Primer on Cryptoasset Valuations - 2024

%20(1).webp)
Cryptoasset valuation remains an emerging topic seeking consensus, especially as the asset class expands and matures. Robert Greer, author of "What is an asset class anyway?" argues that assets that lack an objective measure of value and have a supply constraint are more vulnerable to irrational exuberance, citing the dot-com bubble as an example. Cryptoassets lack an objective measure of value today among investors, similar to emerging tech companies in the late 1990s. We propose valuation methodologies that reconcile various investors' approaches in recent years.
We can value any asset using two approaches – intrinsic or relative. Intrinsic valuation measures an asset's value based on its capacity to generate cash flows. On the other hand, relative valuation methods, also called "pricing," estimate how much to pay for an asset based on what others are paying for comparable ones.
Investors might use a discounted cash flow method (DCF) to value a stock, but they wouldn't use that for a piece of fine art. Similarly, we must outline the various types of cryptoassets to understand the differences we may expect in their value accrual and specific valuation approaches. In this regard, it's helpful to categorize cryptoassets according to the three asset superclasses proposed by Robert Greer:
- Capital Assets: “An ongoing source of something of value” (e.g., bonds and stocks).
- Consumable/Transformable Assets: “You can consume it. You can transform it into another asset. It has economic value. But it does not yield an ongoing stream of value” (e.g., physical commodities).
- Store of Value Assets: “They cannot be consumed, nor can they generate income. Yet they do have value” (e.g., currencies and collectibles).
Like the Internet architecture, cryptoassets and blockchain technology have two layers: (1) infrastructure and (2) applications. In his 2019 work, Chris Burniske categorized cryptoassets at the infrastructure layer based on the consensus mechanism of the blockchain:
- Proof-of-Work (PoW): In PoW networks like Bitcoin, the native asset (BTC) relies on a computationally and energy-intensive lottery called mining to determine which block of transactions to settle on the blockchain and reward the miners. Hence, they belong to the Consumable/Transformable asset superclass, as they essentially create “a digital-native commodity in the form of secure, globally accessible ledger space.” Investors can use the mining cost of production as a fundamental metric to gauge the lower-bound price of PoW crypto assets like BTC.
- Proof-of-Stake (PoS): In networks like Ethereum and Solana, validators must commit a portion of their capital – the “stake,” in this case, ETH – to gain access to a recurring value stream generated by the network’s rules. Hence, they fall in the Capital Asset category, and their value may be derived from the net present value of annual flows to validators using a DCF method.
While we won’t delve too deeply into the application layer, we can apply the same first-principles thinking:
- Governance tokens yield voting rights and represent ownership of the application. They are analogous to common stock in traditional finance, so they fall in the Capital Asset class.
- Utility tokens drive the economics of the system as their sole function, meaning they fall in the Consumable Asset category.
- Non-fungible tokens (NFTs) are collectibles like fine art in their most typical form today, falling in the Store of Value category.
Figure 1: Asset superclasses and their subsets
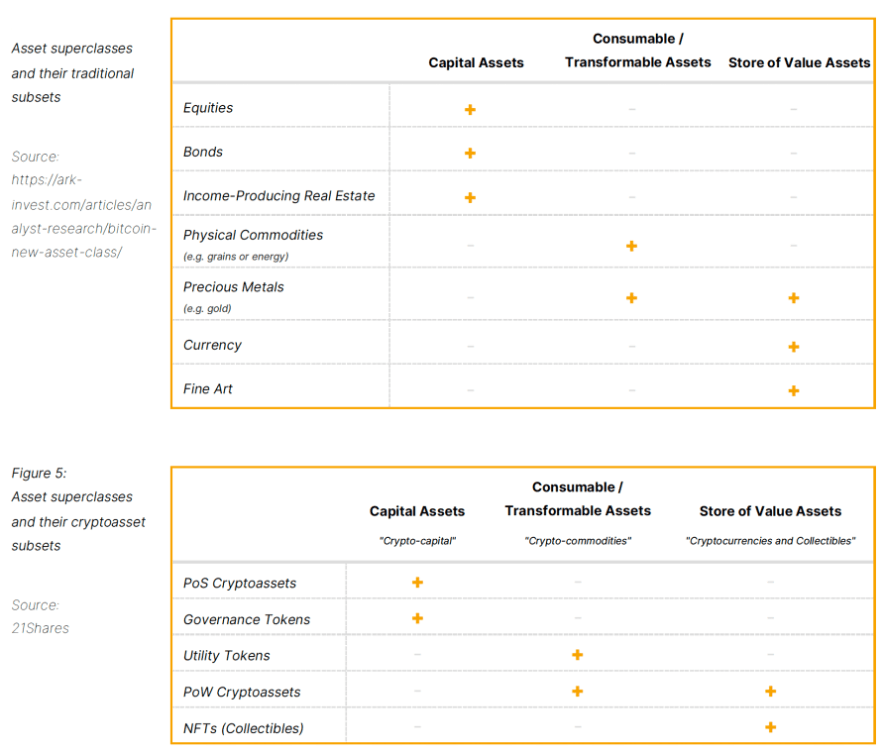
Source: 21Shares
Intrinsic valuation
Ethereum
From the standpoint of a validator, PoS assets like ETH are akin to a stock paying a dividend yield, which means we can conduct a DCF valuation following four simple steps:
1. Estimate the cash flows during the life of the cryptoasset
a. Transaction fees within the network accrue to validators. Just so, fees are a proxy for revenue. Ethereum validators received $401.69 million in transaction fees (net after the burn mechanism) from January 28, 2023, to January 28, 2024.
b. Token issuance doesn’t dilute the value of validators. On the contrary, they have the right to new issuance, similar to how shareholders may receive stock-based compensation. ETH Issuance from January 28, 2023, to January 28, 2024, amounted to $1.48 billion.
c. Total Cash Flows: a + b = ~$1.89 billion in the first year.
2. Estimate expected future cash flows and the lifespan of the crypto asset
a. Future cash flows: We propose a slight variation of the three-stage growth model to project Ethereum’s future cash flows. Specifically, we forecast an initial period of aggressive growth, followed by an incremental decrease that eventually stabilizes at a more moderate growth rate.
b. Lifespan of the asset: With public companies that at least in theory can last forever, equity analysts generally assume that cash flows beyond a specific point in time continue in perpetuity. Investors may apply the same logic to PoS crypto assets, but for simplicity’s sake, we assume ETH’s life will be 20 years.
3. Estimate the discount rate to apply to these cash flows
a. Lower-bound discount rate (9.90%): In the past 10 years, the Invesco QQQ Trust ETF obtained a 9.90% compound annual return.
b. Higher-bound discount rate (21.90%): Obtained using the Fama and French Three-Factor Model (market premium, size premium, and value premium).
4. Estimate the net present value (NPV) of cash flows using the above parameters
Assuming a discount rate of 9.09%, the implied price per one ETH today would be ~$5,315, a 134% increase from ETH’s price ($2,268) as of January 28, 2024. On the other hand, if we use a 21.90% discount rate, the implied price per one ETH would be **$1,349**, a ~41% decrease from ETH’s price as of January 28, 2024. Investors should interpret the results of this DCF valuation with caution and run their own assumptions regarding projected cash flows and discount rates. The rationale behind our approach was to be conservative and capture the high volatility of ETH in the discount rate to accurately reflect the asset’s riskiness. Another implicit assumption of this approach is that the asset’s monetary premium (Store of Value) is embedded into the DCF.
Figure 2: ETH DCF Valuation
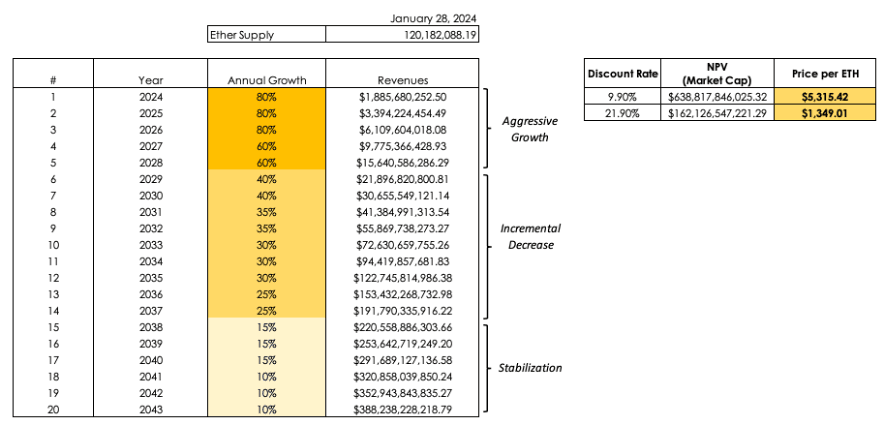
Source: 21Shares, as of January 28, 2024
Bitcoin
When it comes to crypto-commodities, the marginal cost of production is vital as it sets the price floor at which producers (miners) are willing to sell. From the outset, it is crucial to emphasize that we are not suggesting that the price of BTC should be determined by its marginal cost of production. To do so would be to adopt a labor theory of value, which is ostensibly false. Instead, the marginal cost of production is a tool that can help investors estimate a lower bound price level for BTC and other crypto-commodities.
In 2019, Charles Edwards proposed a methodology to estimate the global average US dollar cost of producing one BTC. The first component of the method is the Cambridge Bitcoin Electricity Consumption Index (CBECI), which provides an up-to-date estimate of the Bitcoin network’s daily electricity load. Edwards estimates the cost of production per BTC by:
- Calculating the number of BTC Mined Per Day (based on miner rewards)
- Calculating the daily electricity cost to mine one BTC (Daily Electrical Cost)
- Estimating the global average “Elec-to-Total Cost Ratio” = (Bitcoin Electrical Cost) / (Daily Cost of running a Bitcoin Mining Business)
An investor can then compute Bitcoin Production Cost as (Daily Electrical Cost) / (Elec-to-Total Cost Ratio). Finally, the Bitcoin Production Cost is compared to the “Bitcoin Miner Price,” which attempts to capture the revenue one BTC provides to miners. Bitcoin Miner Price is calculated as follows: BTC Price + (Daily Transaction Fees) / (Daily BTC mined). When the BTC price is below the total cost of mining one BTC, it signals that Bitcoin miners may be struggling and potentially taking short-term losses.
Figure 3: Bitcoin mining cost of production

Source: 21Shares
As of January 28, 2024, the estimated global average electricity cost to mine one BTC is $23,211.1, while the estimated global average total cost to mine one BTC is $38,685.1. To reiterate, investors shouldn’t interpret this range as the fundamental value of Bitcoin, which is subjective, but rather as an estimate of its price floor based on miner profitability and subsequent behavior patterns.
Relative valuation
A significant portion of equity valuations in traditional finance consists of relative valuations based upon market sizing and multiples, such as price-to-earnings (P/E ratio). This approach helps determine whether a given asset is undervalued or overvalued relative to its peers and is more likely to reflect market perceptions and sentiment than a fundamental valuation. Moreover, investors can use relative valuations to "price" any asset, not just ones that generate cash flows.
Solana
In decentralized finance (DeFi), total value locked (TVL) is a crypto-native metric that investors can use as a proxy for assets under management (AUM). Hence, an ingenious pricing approach is to represent the decentralized exchange (DEX) volume of a given network as a multiple of TVL. When comparing two assets, the one with the highest DEX to TVL ratio would be more capital efficient than its peers. Figure 4 shows the top chains based on their DEX to TVL ratio.
Figure 4: DEX volume to TVL ratio of various networks
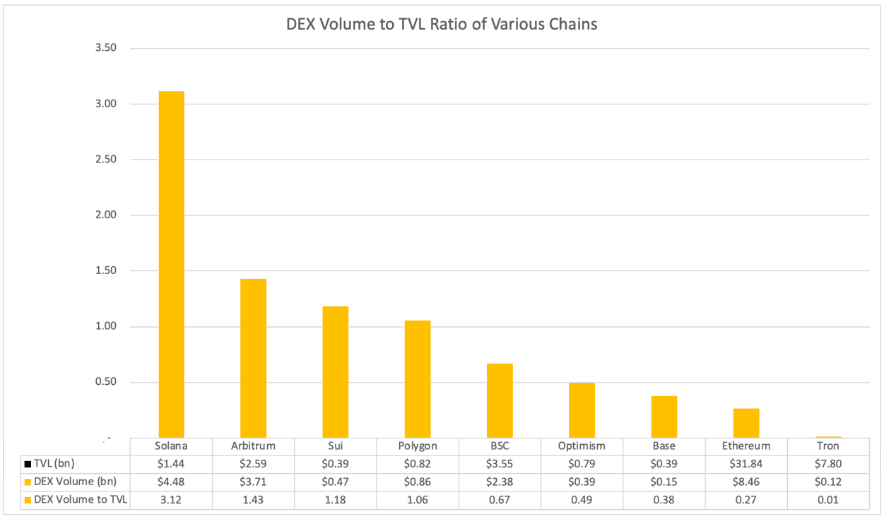
Source: 21Shares
Figure 4 shows Solana's DEX volume to TVL ratio is the highest among the top chains - including L2s and younger L1s like Sui - as of January 30, 2024. Solana is >2x more capital-efficient than the second place, Arbitrum, and >11x Ethereum's base chain. This metric is just one of many showing that Solana went through a rebirth after chain issues in 2021 and 2022 and the FTX collapse. The network has retained a loyal community with ~1,650 monthly active developers and has differentiated itself by offering unparalleled speed and low transaction fees, even compared to L2 solutions. The ecosystem is now thriving with innovative solutions that are hard to pull off in Ethereum-compatible networks in their current state, such as Hivemapper’s decentralized map, Jito’s MEV-powered liquid staking solution, and compressed NFTs.
Bitcoin
Investors cannot value store-of-value assets intrinsically because their value is primarily determined by the subjective beliefs of many individuals. Thus, we can utilize a simple market sizing approach to estimate a target price. The methodology involves establishing a Total Addressable Market (TAM) and a percent share the asset in question could take — Market Penetration. For instance, an investor could price Bitcoin by setting a proportion it could capture of the market value of gold, the seminal store-of-value asset.
As of January 28, 2024, the price of BTC is $42,027, with an implied circulating market cap of ~$826 billion. On the other hand, the market cap of gold sits at around $13.80 trillion. Thus, we can use the market sizing methodology described above to estimate the hypothetical price of BTC if it were to capture a given percent share of gold’s market cap. For instance, Figure 8 shows that if BTC were to capture 10%, it would be priced at $68,218. In the most optimistic scenario contemplated, if BTC penetrates 30% of gold’s market cap, the price of one BTC would be $204,655.
Figure 5: Hypothetical value of BTC as a % of gold’s market cap in 2027
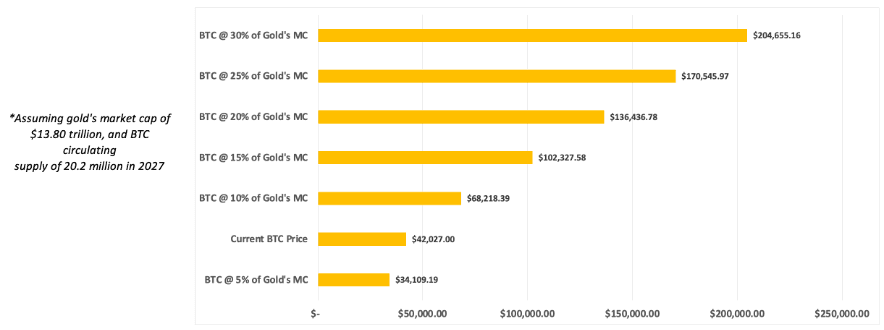
Source: 21Shares, Data as of January 28, 2024.
Methodology improvements – Crypto’s S-Curve
One way to more accurately gauge a given cryptoasset’s level of penetration of its TAM is through the “S-curve.” The S-curve theory states that technologies grow and emerge in multiple waves. It was initially proposed by E.M Rogers in 1962 as the Diffusion of Innovation (DOI) Theory to explain how, over time, a new technology gains momentum and spreads through a specific population or social system.
Figure 6: S-curve and the Diffusion of Innovation Theory
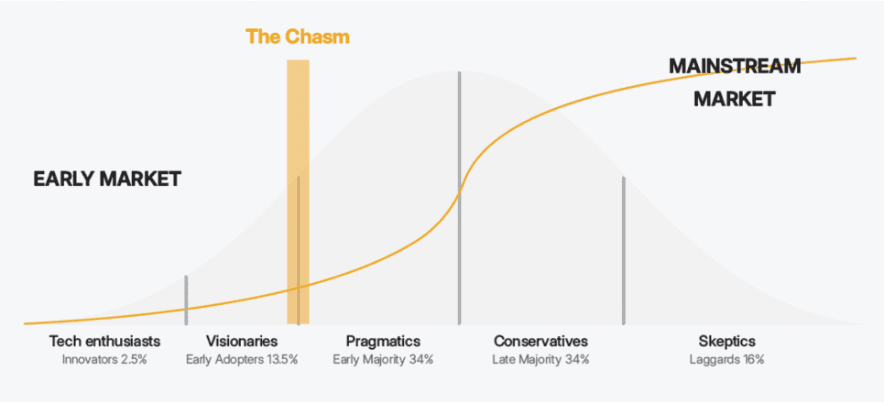
Source: 21Shares
There were 431 million crypto users globally at the beginning of 2023, representing about 5.36% of the world population.
The level of crypto adoption today is equivalent to internet adoption in 1999-2000.
Challenges to crypto asset valuations
There are various challenges and shortcomings regarding cryptoasset valuations, such as insufficient historical data and complexities unique to the asset class.
For instance, the cash flows that PoS networks generate are not paid in fiat currency but rather in the native tokens of the network. This situation is as if Apple charged its customers in Apple shares instead of U.S. dollars. This unique feature creates a reflexivity problem because the dollar-denominated value of the revenue stream is directly dependent on the crypto asset's value.
We have provided investors with actionable methods to value cryptoassets. The complexity and uncertainty of valuing this asset class might intimidate investors. However, it is worth remembering that the more uncomfortable an investor feels when valuing an asset, the greater the payoff of doing the valuation.
Disclaimer
This document is not an offer to sell or a solicitation of an offer to buy or subscribe for securities of 21Shares AG. Neither this document nor anything contained herein shall form the basis of, or be relied upon in connection with, any offer or commitment whatsoever in any jurisdiction. This document and the information contained herein are not for distribution in or into (directly or indirectly) the United States, Canada, Australia or Japan or any other jurisdiction in which the distribution or release would be unlawful.This document does not constitute an offer of securities for sale in or into the United States, Canada, Australia or Japan. The securities of 21Shares AG to which these materials relate have not been and will not be registered under the United States Securities Act of 1933, as amended (the “Securities Act”), and may not be offered or sold in the United States absent registration or an applicable exemption from, or in a transaction not subject to, the registration requirements of the Securities Act. There will not be a public offering of securities in the United States.
This document is only being distributed to and is only directed at: (i) to investment professionals falling within Article 19(5) of the Financial Services and Markets Act 2000 (“FSMA”) (Financial Promotion) Order 2005 (the “Order”); or (ii) high net worth entities, and other persons to whom it may lawfully be communicated, falling within Article 49(2)(a) to (d) of the Order (all such persons together being referred to as “relevant persons”); or (iii) any other persons to whom this document can be lawfully distributed in circumstances where section 21(1) of the FSMA does not apply. The securities are only available to, and any invitation, offer or agreement to subscribe, purchase or otherwise acquire such securities will be engaged in only with, relevant persons. Any person who is not a relevant person should not act or rely on this document or any of its contents.In any EEA Member State (other than the Austria, Belgium, Croatia, Denmark, Finland, France, Germany, Great Britain, Hungary, Ireland, Italy, Liechtenstein, Luxembourg, Malta, The Netherlands, Norway, Poland, Romania, Slovakia, Spain and Sweden) that has implemented the Prospectus Regulation (EU) 2017/1129, together with any applicable implementing measures in any Member State, the “Prospectus Regulation”) this communication is only addressed to and is only directed at qualified investors in that Member State within the meaning of the Prospectus Regulation.
Exclusively for potential investors in Austria, Belgium, Croatia, Denmark, Finland, France, Germany, Great Britain, Hungary, Ireland, Italy, Liechtenstein, Luxembourg, Malta, The Netherlands, Norway, Poland, Romania, Slovakia, Spain and Sweden the 2021 Base Prospectus (EU) is made available on the Issuer’s website under www.21Shares.com.The approval of the 2021 Base Prospectus (EU) should not be understood as an endorsement by the SFSA of the securities offered or admitted to trading on a regulated market. Eligible potential investors should read the 2021 Base Prospectus (EU) and the relevant Final Terms before making an investment decision in order to understand the potential risks associated with the decision to invest in the securities. You are about to purchase a product that is not simple and may be difficult to understand.
This document constitutes advertisement within the meaning of the Swiss Financial Services Act (the “FinSA”) and not a prospectus. In accordance with article 109 of the Swiss Financial Services Ordinance, the Base Prospectus dated 12 November 2021, as supplemented from time to time and the final terms for any product issued have been prepared in compliance with articles 652a and 1156 of the Swiss Code of Obligations, as such articles were in effect immediately prior to the entry into effect of the FinSA, and the Listing Rules of the SIX Swiss Exchange in their version in force as of January 1, 2020. Consequently, the Prospectus has not been and will not be reviewed or approved by a Swiss review body pursuant to article 51 of the FinSA, and does not comply with the disclosure requirements applicable to a prospectus approved by such a review body under the FinSA.