Die dualen Themen der Risikoneubewertung und Kapitalselektivität


Von Maximiliaan Michielsen and Stephen Coltman, mit Unterstützung von Eliezer Ndinga und Adrian Fritz.
Der Februar setzte die makroökonomisch getriebene Risikoneubewertung und das Neupositionieren aus dem Januar fort. Der Kursrückgang wurde durch straffere Marktbedingungen, ein anlagenübergreifendes De-risking und den Abbau spekulativer Exzesse bei Bitcoin und digitalen Assets getrieben. Entscheidend ist, dass diese Anpassung ohne systemischen Stress erfolgte. Dies bestärkt die Ansicht, dass die jüngste Schwäche eher eine Korrekturphase widerspiegelt als ein Scheitern der langfristigen These von Bitcoin als aufstrebendes, langfristiges Store-of-Value-Asset.
Was geschah im Februar?
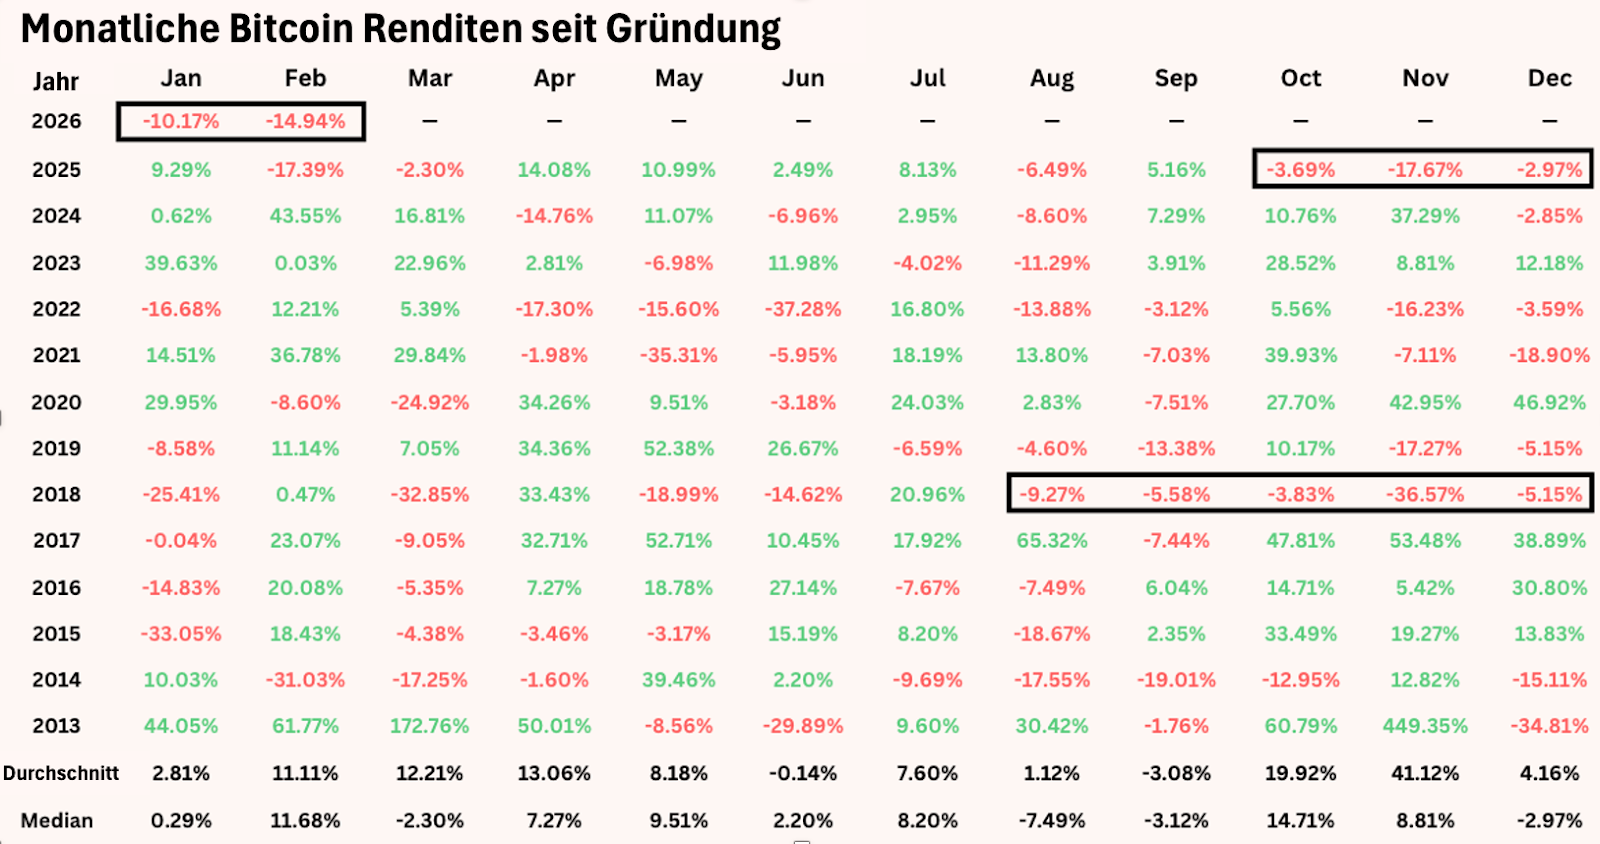
Der Februar verlängerte eine der hartnäckigsten Korrekturphasen des aktuellen Zyklus. Nach einer starken Risk-off-Bewegung ging Bitcoin in eine Konsolidierung über und stabilisierte sich weitgehend zwischen 60.000 $ und 70.000 $. Dennoch ist er auf dem Weg, den fünften negativen Monatsschluss in Folge zu verzeichnen, eine Serie, die es zuletzt Ende 2018 gab.
Der Vergleich unterstreicht jedoch, wie sehr der Markt gereift ist. In der früheren Ära fiel Bitcoin um etwa 80 % von seinem Hochpunkt, bei einer annualisierten Volatilität von über 100 %. Heute stehen wir etwa 45 % unter dem Allzeithoch, bei einer einjährigen annualisierten Volatilität von nah an 40 %. Obwohl die Dauer der Schwächephase bemerkenswert ist, sind das Ausmaß und das Volatilitätsprofil wesentlich geringer. Dies untermauert die Einschätzung, dass es sich um eine Korrekturphase innerhalb eines reiferen Marktumfelds handelt und nicht um eine Rückkehr zur früheren Fragilität.
Wichtig ist, dass die makroökonomische Dynamik derzeit das Kursgeschehen dominiert, obwohl die Branche branchenweit an Zugkraft gewinnt. Das Angebot an Stablecoins wächst weiter; Circle lieferte starke Quartalszahlen; Prognosemärkte (Prediction Markets) haben im bisherigen Jahresverlauf ein Volumen von über 45 Milliarden $ überschritten; und das Bitcoin Lightning Network verarbeitet ein monatliches Volumen von über 1 Milliarde $, was die Nutzbarkeit von Bitcoin als Infrastruktur für den Werttransfer weiter ausbaut.
Parallel dazu konnten ausgewählte Protokolle bei den Fundamentaldaten weiterhin eine Outperformance erzielen. Die Divergenz zwischen dem Preis und dem zugrunde liegenden Branchenwachstum stützt die Ansicht, dass diese Phase keine strukturelle Verschlechterung widerspiegelt. Dennoch schneidet Bitcoin weiterhin besser ab als der breitere Kryptomarkt, der um etwa 150 Milliarden $ schrumpfte, was ein Marktumfeld von „Qualität vor Breite“ bekräftigt.
Es gibt 5 Gründe für den Kursrückgang
Der Kursrückgang im Februar spiegelt konvergierende Kräfte wider, die den Abwärtsdruck verstärkt haben.
1) Makroökonomisches Umfeld: Politische Unsicherheit, Zollrisiken und geopolitische Eskalation
Die Schwäche im Februar wurde durch ein sich verschlechterndes Umfeld getrieben, das die straffen Bedingungen aufrechterhielt und den Risikoappetit einschränkte:
- Das Wachstum verlangsamte sich: Das US-Bruttoinlandsprodukt (BIP) für das 4. Quartal verlangsamte sich auf annualisierte 1,4 %. Dies lag deutlich unter dem Konsens und massiv unter den 4,4 % aus dem 3. Quartal, was auf eine nachlassende Dynamik hindeutet.
- Die Inflation blieb hartnäckig: Die PCE-Kernrate (Personal Consumer Expenditures) bewegte sich um 2,9 % im Jahresvergleich und damit weiterhin über dem 2-Prozent-Ziel der Fed, was den Spielraum für kurzfristige Lockerungen einschränkte.
- Neubewertung der Zinsen (Rates Repricing): Diese Kombination bestärkte eine „Higher-for-longer“-Haltung und verschob die Erwartungen für die erste Zinssenkung in Richtung Jahresmitte. Laut CME FedWatch gilt der Juli mittlerweile als das wahrscheinlichste Zeitfenster für den ersten Zinsschritt.
- Politische Unsicherheit: Ein Urteil des Obersten Gerichtshofs, das die Befugnisse für Notfallzölle einschränkt, sowie neu angekündigte globale Zölle von bis zu 15 % führten erneut Handelsrisiken ein. Dies sorgte für zusätzliche Volatilität und verstärkte ein vorsichtiges Risk-off-Umfeld.
- Geopolitische Eskalation: Angriffe auf den Iran gegen Ende des Monats und eine regionale Eskalation lösten einen heftigen, aber begrenzten Schock aus. Die Märkte preisen einen relativ kurzen Konflikthorizont ein, wobei sich die Entscheidungsträger bewusst sind, dass eine längere Unterbrechung – insbesondere der Aktivitäten an der Straße von Hormus – die Bedingungen verschärfen und die ohnehin fragilen Wachstumserwartungen unter Druck setzen würde.
2) Risikoneubewertung des Innovationssektors
Da sich die Märkte von dem allgemeinen Narrativ „KI nützt jedem“ hin zu einer selektiveren Bewertung von Gewinnern und Verlierern bewegten, verzeichneten wachstumsstarke Software- und Innovationsaktien deutliche Rücksetzer. Obwohl Bitcoin weder ein direkter Konkurrent zu KI noch eine veraltete Technologie ist, handelte er während der Risk-off-Phase im Gleichschritt mit dem breiteren Innovationssektor.
Der iShares Tech-Software ETF („IGV“) sank im Februar um mehr als 14 %, während Bitcoin um etwa 17 % fiel, wobei die tägliche Korrelation auf über 60 % stieg. Diese Angleichung deutet darauf hin, dass die anlagenübergreifende Risikoreduzierung und nicht eine krypto-spezifische Verschlechterung der Haupttreiber der Kursentwicklung war.
Ähnliche Dynamiken zeigten sich 2018–2019, als Fintech-Aktien das Wachstumsnarrativ anführten, während Bitcoin an ihrer Seite eine Underperformance verzeichnete, bevor er später als Relative-Value-Trade wieder aufholte. Bemerkenswerterweise markierte dieser Zeitraum auch das letzte Mal eine Serie von fünf aufeinanderfolgenden Monaten mit einem Kursrückgang.
3) Leverage-Resets und Schockabsorption
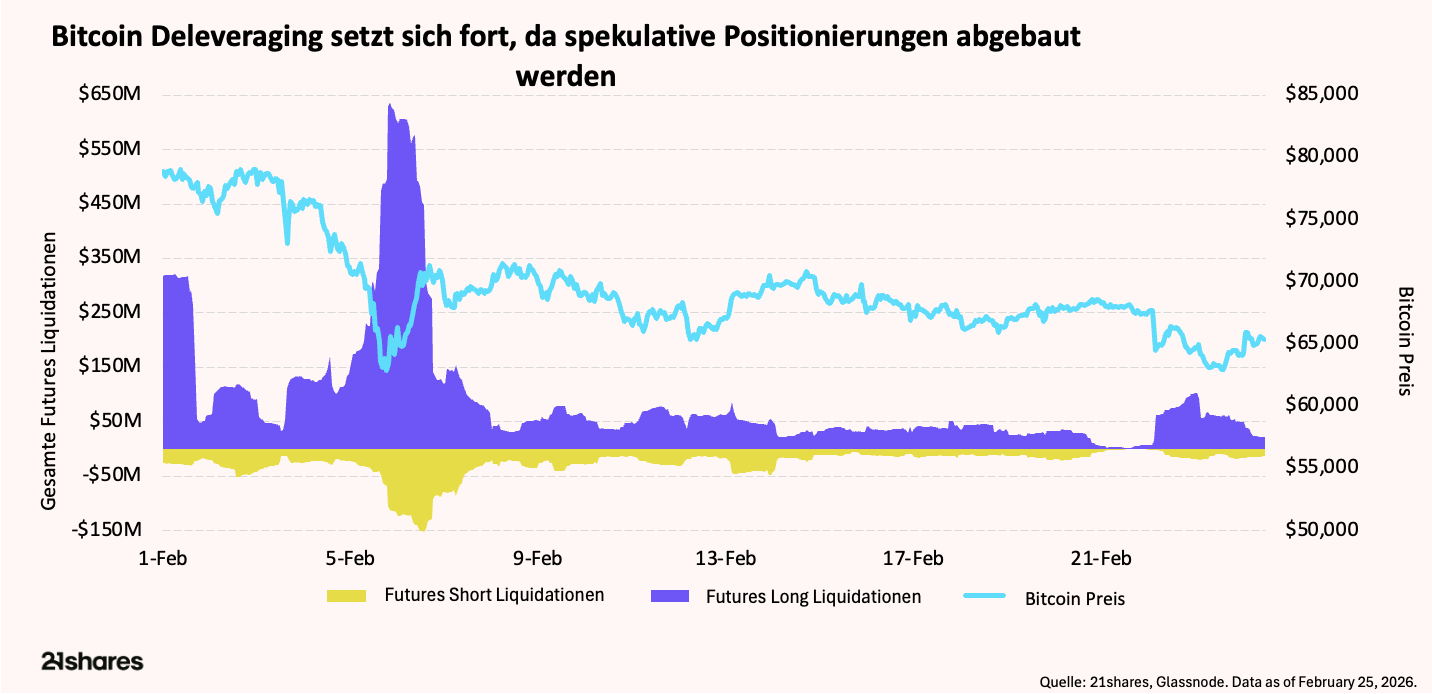
Krypto fungierte erneut als Liquiditäts-Stoßdämpfer. Da der Markt rund um die Uhr geöffnet ist, schlagen sich Risk-off-Positionierungen sofort nieder. Diese Dynamik löste ein scharfes, aber konstruktives Deleveraging aus:
- Liquidierungen von Long-Futures in Höhe von 1,4 Milliarden $, etwa doppelt so viele wie bei den Shorts, da die Kursrückgänge am Spotmarkt kaskadenartig durch die Derivatemärkte verliefen.
- Das Open Interest bei Futures fiel um 5 Milliarden $ und schrumpfte damit zurück auf das Niveau vor dem ETF-Launch.
- Das aktuelle Open Interest liegt bei etwa 27 Milliarden $, was deutlich unter den Höchstständen vom Oktober (über 65 Milliarden $) liegt.
Dies verstärkte zwar die kurzfristigen Preisbewegungen, spiegelt jedoch eine Bereinigung der Positionierungen und keinen fundamentalen Stress wider. Überschüssiger Leverage, der sich früher im Zyklus angesammelt hatte, wurde abgebaut. Dies reduziert die Marktenge und verringert die Anfälligkeit für weitere Rücksetzer in der nächsten Phase.
4) Nervosität bei langfristigen Bitcoin-Haltern
Die Kapitalflüsse verstärkten die Volatilität, waren aber nicht deren Ursprung. Die Abflüsse aus globalen Bitcoin-ETPs waren größtenteils eine Reaktion auf die Preisschwäche und nicht deren Auslöser; sie beliefen sich im Laufe des Monats auf insgesamt etwa 450 Millionen $, wobei US-ETFs den Großteil der Abflüsse ausmachten.
On-chain-Daten zeigen eine moderate Umverteilung durch langfristige Halter (Long-term holder). Das Angebot dieser Gruppe sank um etwa 67.000 BTC im Wert von rund 5 Milliarden $, während die Anzahl der Entitäten, die ≥ 1.000 BTC halten (etwa 66 Millionen $ zu aktuellen Preisen), nur um 15 sank. Dies deutet darauf hin, dass die Bestände der Großinvestoren weitgehend intakt bleiben.
5) Altcoin-Fragilität und schwindende Marktbreite
Abgesehen von einigen wenigen fundamental starken Assets bleibt die Beteiligung außerhalb von Bitcoin begrenzt. Da die Risikotoleranz sank, verzeichneten Altcoins eine unterdurchschnittliche Wertentwicklung, was die Marktbreite verringerte und die relative Widerstandsfähigkeit von Bitcoin stärkte. Dieses Muster ist typisch für Korrekturphasen, in denen sich das Kapital in Richtung höherer Qualität konsolidiert.
What are the technicals telling us?
Derivate und allgemeine Positionierung
Die Funding Rates bleiben gedrückt, und die Basis ist von den Höchstständen im Oktober (nahe 8 %) auf unter 5 % deutlich geschrumpft. Dies spiegelt den verringerten Leverage und den begrenzten Anreiz für Institutionen wider, wieder aggressiv in den Markt einzusteigen.
An den Optionsmärkten hält die Absicherung gegen Kursabfälle unterhalb von 60.000 $ an. Der Skew bleibt jedoch begrenzt, und die implizite Volatilität hat sich weiter entspannt. Dies passt eher zu einer Konsolidierung als zu einem neuen Abwärtsmomentum.
Die Max Pain-Level auf Deribit liefern weiteren Kontext. Kurzfristige Verfallstermine häufen sich im mittleren 60.000 $-Bereich, während der Max Pain für das Quartalsende eher gegen 75.000 $ tendiert. Dies deutet auf eine kurzfristige Anziehungskraft der aktuellen Kurslevel hin, während zum Quartalsende hin größere Konzentrationen weit über dem aktuellen Spot-Preis liegen. Die Positionierung bleibt leicht defensiv, was eine Seitwärtsbewegung unterstützt.
Technische Struktur: Definierte Handelsspanne mit klaren Wendepunkten
Das Kursgeschehen hat einen klaren Rahmen verdeutlicht, der durch frühere Zyklushöchststände und Konsolidierungszonen mit hohem Handelsvolumen geformt wurde.
Wichtige Unterstützungszonen
- 60.000 $ bis 65.000 $: Strukturelle Unterstützung der Handelsspanne: Diese Region stellt einen volumenstarken Konsolidierungsknoten aus dem Jahr 2024 dar. Erhebliche historische Handelsaktivität verstärkt diese Zone als strukturelle Unterstützung. Zudem deckt sie sich eng mit dem Allzeithoch des Zyklus von 2021, was ihr sowohl technische als auch psychologische Bedeutung verleiht. Ein nachhaltiges Halten dieses Bereichs stützt die allgemeine Konsolidierungsthese.
- 56.000 $ bis 58.000 $: Langfristiger struktureller Boden: Diese Zone spiegelt das Zusammentreffen von langfristigen Kostenbasis-Metriken und Unterstützungen aus früheren Zyklen wider. Ein dauerhafter Durchbruch nach unten würde die Struktur wesentlich schwächen und die Wahrscheinlichkeit einer tieferen Korrekturphase erhöhen.
Wichtige Widerstandsniveaus
- 68.000 $ bis 70.000 $: Angebotszone des vorherigen Zyklus: Diese Spanne entspricht der Region des Allzeithochs von 2021. Hier bleibt das Verkaufsangebot (Overhead Supply) konzentriert, was sie zum ersten bedeutenden Widerstandsband und zum ersten Test für ein Aufwärtsmomentum macht.
- 72.000 $ bis 74.000 $: „Liberation Day“ (April 2025) Durchbruchszone: Die Rückeroberung dieses Bereichs würde signalisieren, dass der Einbruch vom Februar in eine Stabilisierung übergegangen ist, statt in einen weiteren Abverkauf (Distribution).
- 80.000 $ bis 85.000 $: Zone der Trendbestätigung: Ein dauerhaftes Akzeptieren von Kursen über 80.000 $würde auf eine Stabilisierung hindeuten. Ein entschlossenes Halten über 85.000$ ließe darauf schließen, dass die panikgetriebene Phase überwunden ist und sich der Fortsetzungstrend wieder durchsetzt.
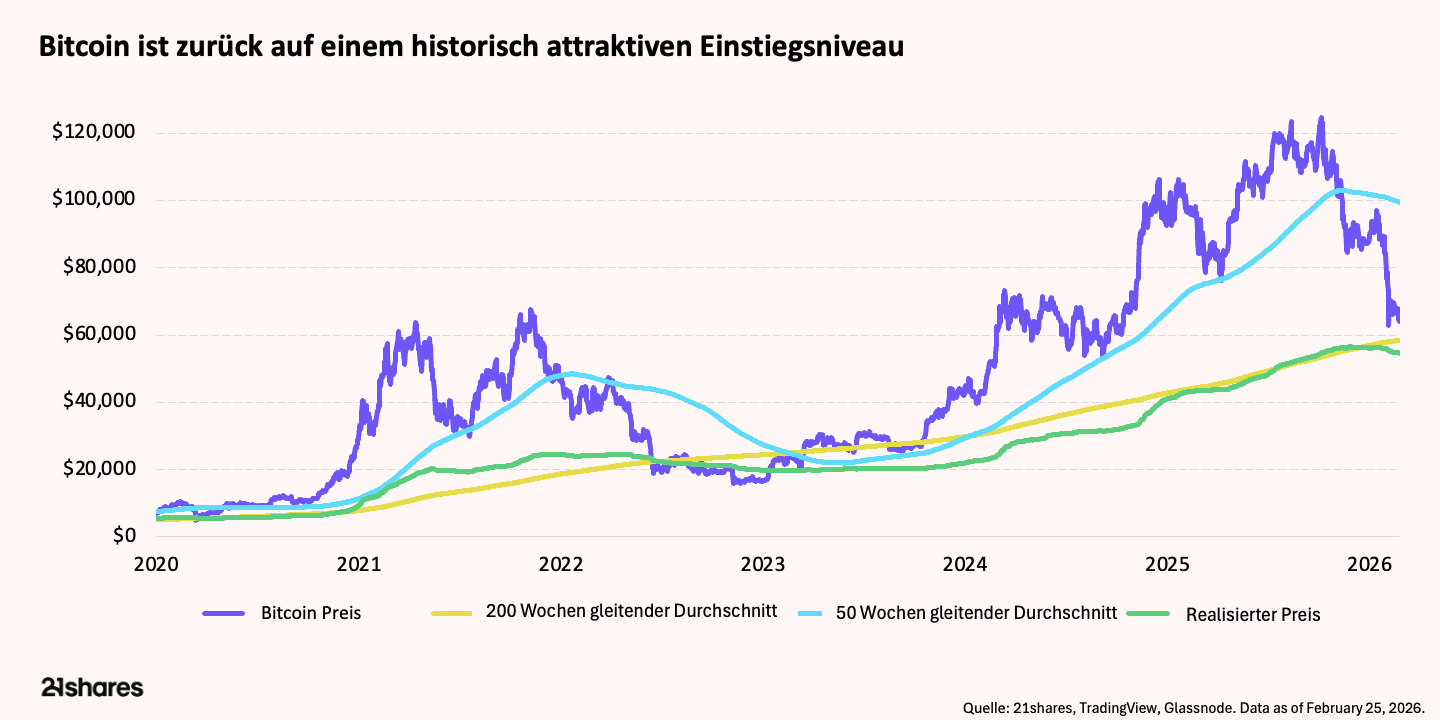
Langfristiger Bewertungsanker wieder im Fokus
Bitcoin handelt nahe der Zyklustiefs, wobei es Anzeichen dafür gibt, dass langfristige Investoren Bitcoin mit einem Preisabschlag (at a discount) kaufen. Der Preis bewegt sich um die aggregierte Kostenbasis der Investoren und den gleitenden 200-Wochen-Durchschnitt, eine Region, in der Bitcoin historisch gesehen weniger als 5 % der Zeit gehandelt wurde. Frühere Interaktionen mit dieser Zone gingen konsistent starken, mehrjährigen Aufwärtsbewegungen voraus, da sich die Marktstruktur zurücksetzt und längerfristiges Kapital wieder einsteigt.
Da der Leverage reduziert ist, die Derivatemärkte bereinigt sind und die Bestände der langfristigen Halter intakt bleiben, stellen die aktuellen Niveaus zunehmend eine attraktive Akkumulationszone dar, selbst wenn die kurzfristige Volatilität bestehen bleibt.
______
Fußnoten:
- "CME FedWatch Tool," CME Group. Accessed March 2, 2026. https://www.cmegroup.com/markets/interest-rates/cme-fedwatch-tool.html
This report has been prepared and issued by 21Shares AG for publication globally. All information used in the publication of this report has been compiled from publicly available sources that are believed to be reliable, however, we do not guarantee the accuracy or completeness of this report. Crypto asset trading involves a high degree of risk. The crypto asset market is new to many and unproven and may have the potential not to grow as expected.Currently, there is relatively small use of crypto assets in the retail and commercial marketplace in comparison to relatively large use by speculators, thus contributing to price volatility that could adversely affect an investment in crypto assets. In order to participate in the trading of crypto assets, you should be capable of evaluating the merits and risks of the investment and be able to bear the economic risk of losing your entire investment.Nothing herein does or should be considered as an offer to buy or sell or solicitation to buy or invest in crypto assets or derivatives. This report is provided for information and research purposes only and should not be construed or presented as an offer or solicitation for any investment. The information provided does not constitute a prospectus or any offering and does not contain or constitute an offer to sell or solicit an offer to invest in any jurisdiction. The crypto assets or derivatives and/or any services contained or referred to herein may not be suitable for you and it is recommended that you consult an independent advisor. Nothing herein constitutes investment, legal, accounting or tax advice, or a representation that any investment or strategy is suitable or appropriate to your individual circumstances or otherwise constitutes a personal recommendation. Neither 21Shares AG nor any of its affiliates accept liability for loss arising from the use of the material presented or discussed herein.Readers are cautioned that any forward-looking statements are not guarantees of future performance and involve risks and uncertainties and that actual results may differ materially from those in the forward-looking statements as a result of various factors.This report may contain or refer to material that is not directed to, or intended for distribution to or use by, any person or entity who is a citizen or resident of or located in any locality, state, country or other jurisdiction where such distribution, publication, availability or use would be contrary to law or regulation or which would subject 21Shares AG or any of its affiliates to any registration, affiliation, approval or licensing requirement within such jurisdiction.