Explore our real-time on-chain analytics dashboards for industry-leading market insights, fundamental analysis, and signals to keep you ahead in the crypto landscape.
Explore our Dune Dashboards

Dashboards
Article page link

Hyperliquid
Description: Hyperliquid is a purpose-built onchain derivatives exchange designed for high-performance, fully onchain trading. Launched as a custom Layer 1, it focuses on delivering centralized exchange–level speed and user experience while maintaining self-custody and transparency.
Article page link

Bitcoin Key Metrics
In this dashboard, you will explore an overview of Bitcoin's financial performance along with an in-depth analysis of the network's fundamental value.
Article page link
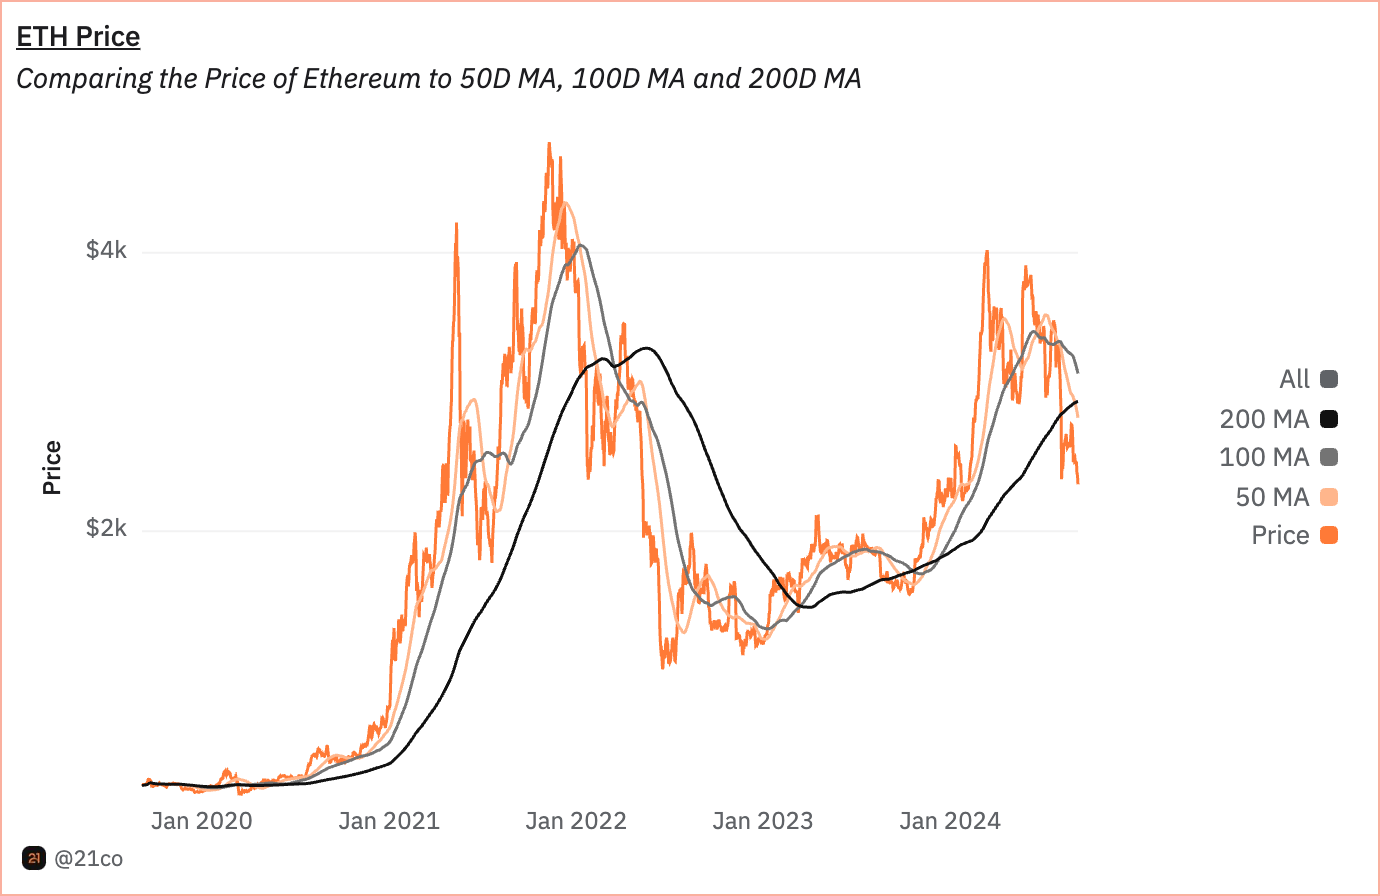
Ethereum Key Metrics
Ethereum is a smart contract platform that powers thousands of decentralized applications to build on top.In this dashboard, you will explore the financial performance of Ethereum, along with a deep dive into the network's fundamental and on-chain metrics.
Article page link
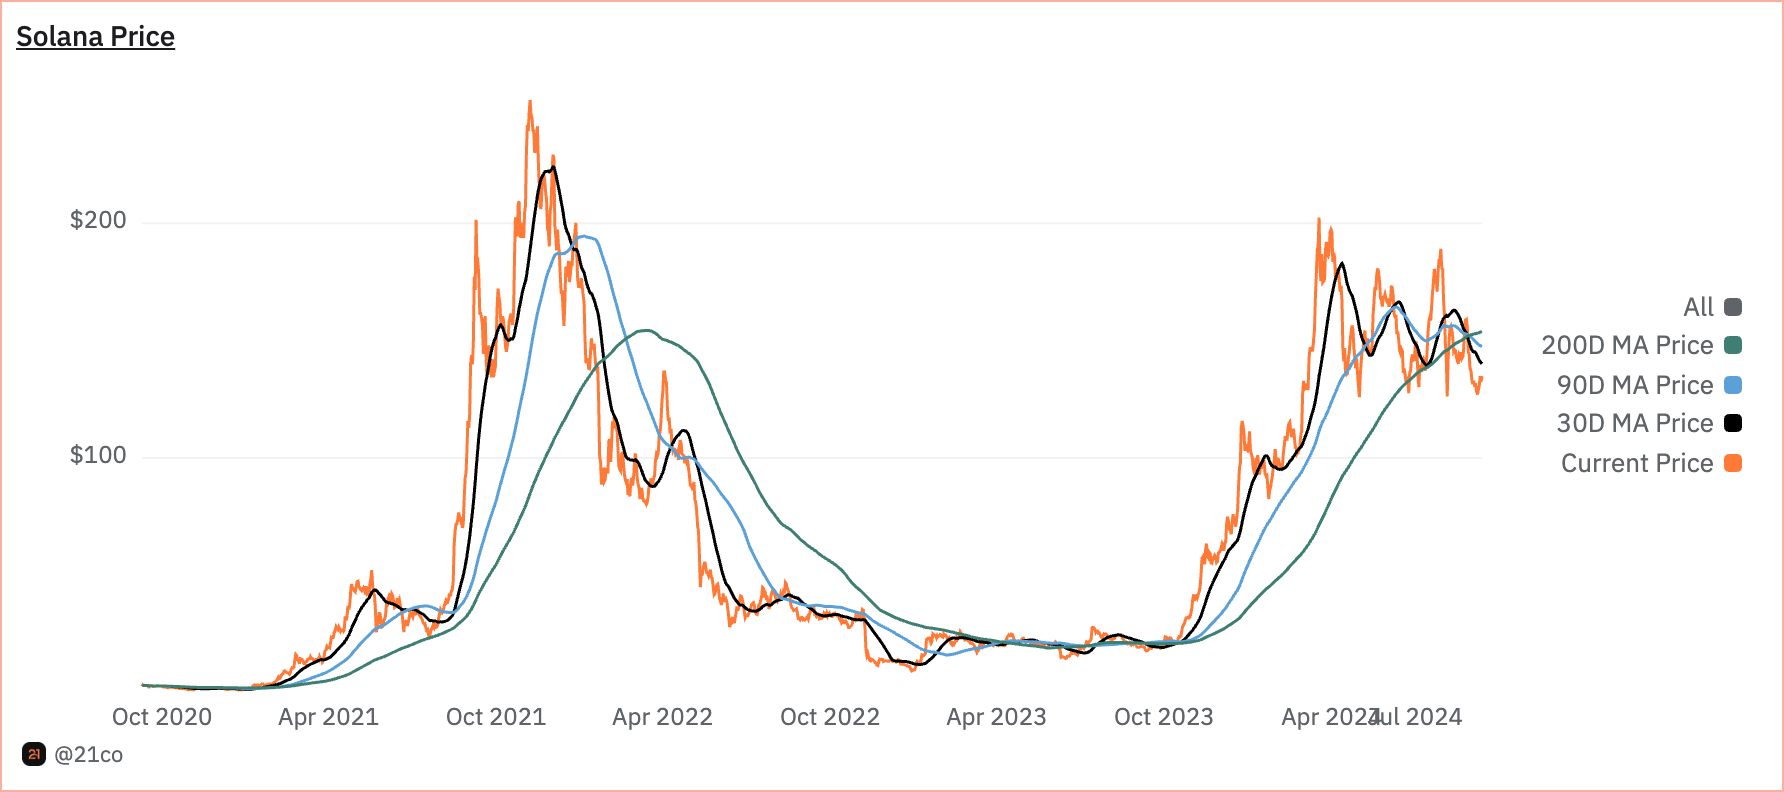
Solana Key Metrics
Solana is a high throughput proof-of-stake smart contract platform similar to Ethereum. In this dashboard, you will explore the financial performance of Solana, along with a deep dive into the network's fundamental and on-chain metrics.
Article page link
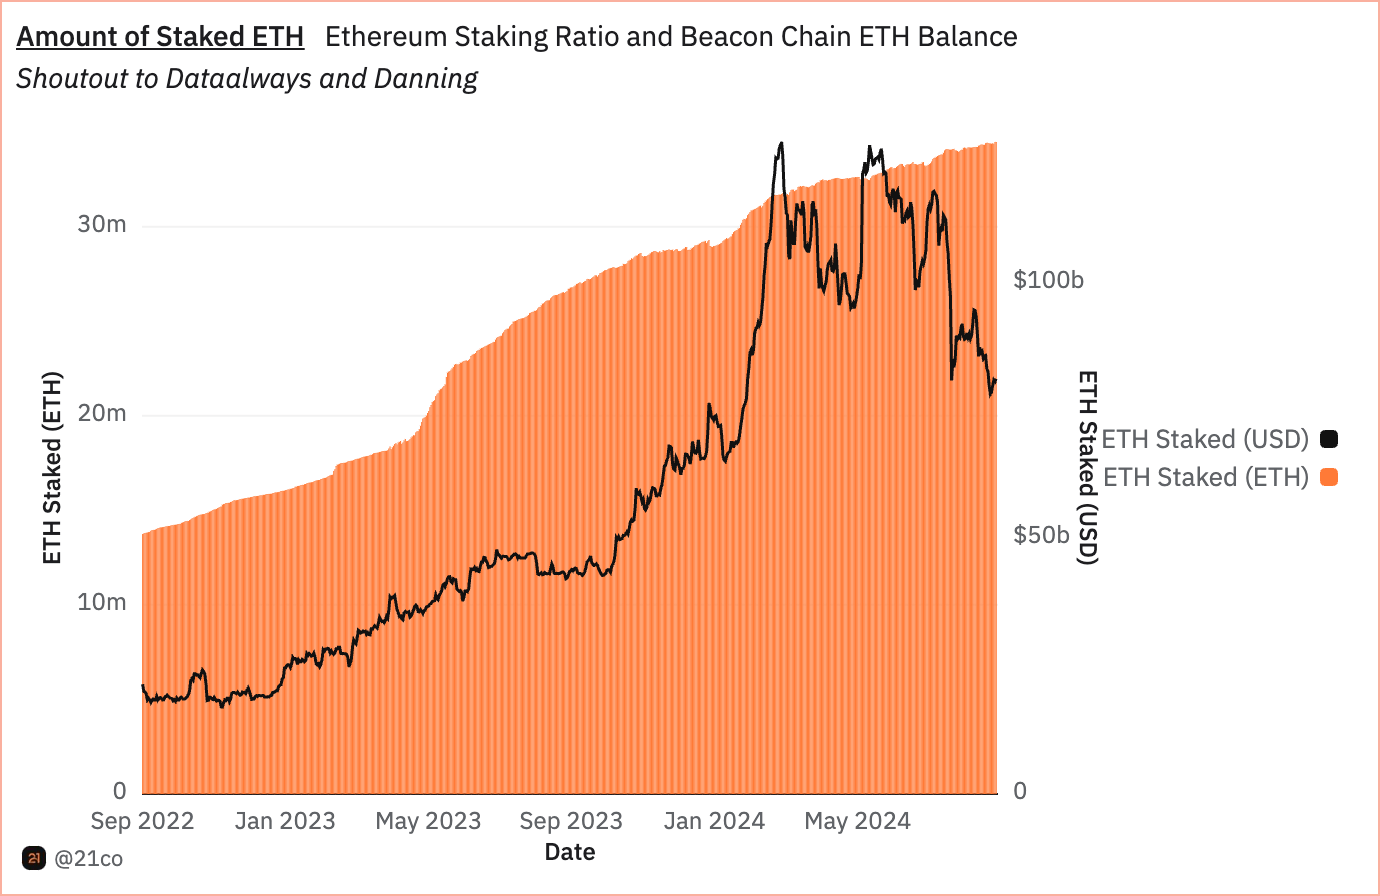
Staking: Overview
Currently, staking represents a $140B+ industry. This dashboard provides key metrics and insights on staking activities within Proof-of-Stake (PoS) networks like Ethereum and Solana. It helps you understand the staking yield, networks' security, monetary policy, and overall health.
Article page link

Tokenization: Overview
In this dashboard, you will explore the state and adoption of tokenization by asset class and blockchain
Article page link
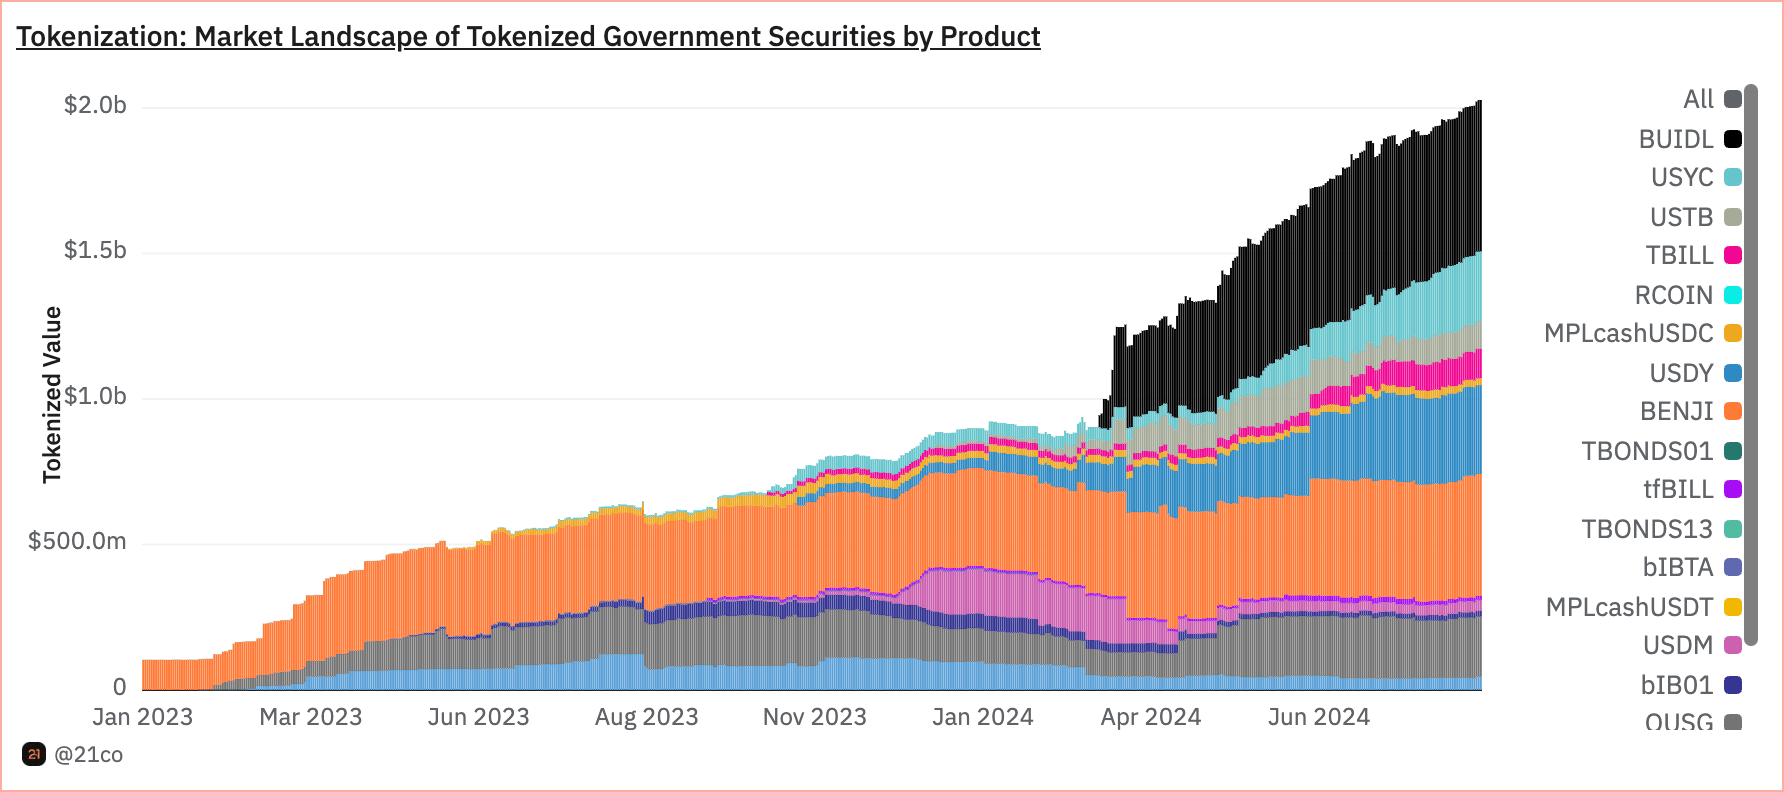
Tokenization: Government Securities
In this dashboard, you will explore the tokenization of Money Market Fund, where projects like Ondo Finance and traditional players like Franklin Templeton have brought US Treasuries on-chain, attracting close to $2B AUM
