How Bitcoin decoupled from broader reaction to uncertainty


With additional contributions from Stephen Coltman.
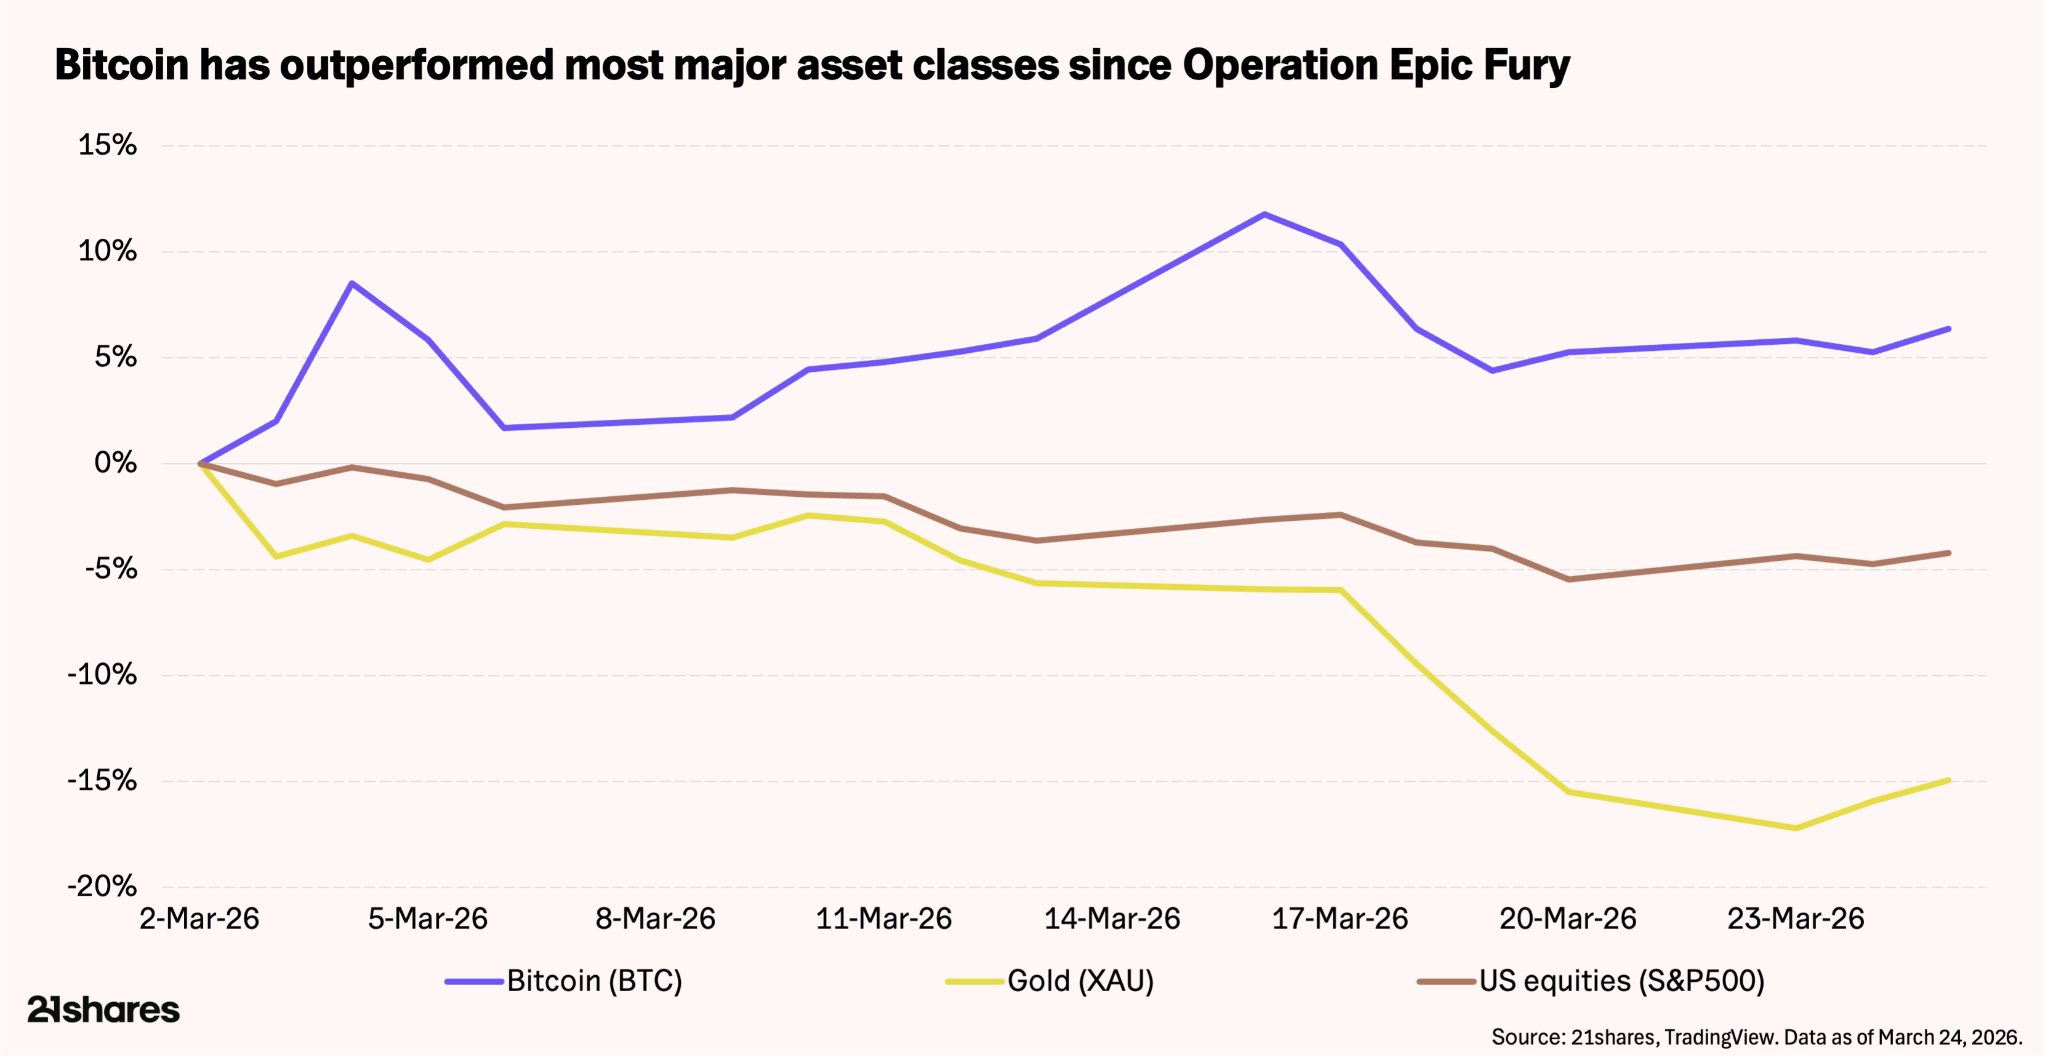
March was a difficult month across traditional markets. Bitcoin, by contrast, stood out as one of the clearest relative outperformers. Against the backdrop of the US–Israeli operation against Iran, rising oil prices, and renewed inflation fears, Bitcoin gained 7% on the month while the S&P 500 declined roughly 4%, the 10-year bond (US10Y) grew by almost 11%, gold dropped 11.5%, and silver lost 5%.
This marked a notable shift in behaviour, but it was driven more by timing than any fundamental change in Bitcoin itself. March was unusual as gold and Treasuries, the usual safe havens, sold off alongside equities. Bitcoin typically falls sharply in these environments as well, but this time, most of the selling had already played out. After five consecutive negative months, excess positioning had largely been cleared, and forced sellers were exhausted. Thus, Bitcoin held up not because it suddenly became a hedge, but because there was simply less left to sell, aided by early signs of marginal buyers stepping back in.
What happened in March?
March's price action was primarily driven by Operation Epic Fury. The US–Israeli escalation in the Strait of Hormuz – a chokepoint for 20% of global oil – sent Brent crude above $100/bbl, reigniting inflation fears. Consequently, global yields spiked as the US 20Y treasury breached 5% for the first time since April 2025, solidifying a "higher-for-longer" interest rate regime. Furthermore, interest rate hikes returned to the conversation globally.
Bitcoin responded by surging from $66,000 to a local peak of $76,000 before consolidating above the support floor we pointed to last month.
On the macro side, data remained largely mixed. While US CPI hit 2.4% YoY, US PPI arrived hotter than expected. Although the US Fed held rates steady on March 17–18, the higher-for-longer narrative has become more entrenched, with CME FedWatch pushing back the first expected cut, reflecting growing acceptance that rates will stay higher for longer than previously hoped.
On the regulatory front, March 17 also delivered a landmark moment: the SEC and CFTC jointly classified 16 major crypto assets as digital commodities rather than securities – a development we explore in more detail in the following section.
Reasons supporting crypto’s price action
Regulatory clarity as a fundamental catalyst
On March 17, the SEC and CFTC jointly classified 16 major cryptoassets – including Bitcoin, Ethereum, XRP, Solana, and more – as digital commodities under CFTC jurisdiction. This release supersedes the Gensler-era enforcement framework, removing a multi-year regulatory overhang that previously suppressed institutional participation.
While the CLARITY Act is still required to make these classifications permanent (without it, a future SEC chair could reverse the March 17 interpretation), its path through the Senate has been uneven. Senators Tillis and Alsobrooks reached an agreement in principle on stablecoin yield on March 20, but the draft language proved more restrictive than expected. Coinbase rejected the latest text this week, the second time it has pulled support. Other sticking points remain, including oversight of DeFi and ethics provisions. For investors, the key variable is timing. If the bill does not reach the Senate floor by May, it risks being shelved until after the midterms. That said, political tailwinds remain strong: Trump has framed the Act as a strategic priority, the SEC and CFTC have already signed the memorandum of understanding the Act would require, and prediction market odds for 2026 passage sit at roughly 62%1.
Bitcoin’s hedge thesis should absorb the unfavorable outlook
The energy supply disruption from the Strait of Hormuz closure has materially added to the upward pressure on an already stubborn inflation outlook. Current Polymarket odds price only a ~37%2 chance of Hormuz traffic returning to normal by end of April, and while a US-Iran ceasefire by June 30 sits at 65%, near-term resolution odds remain much lower – suggesting markets are not expecting a rapid resolution.
Ordinarily, that backdrop should be a headwind. Higher oil prices, firmer inflation expectations, and tighter financial conditions would typically weigh on liquidity-sensitive assets. Yet March’s price action suggests more nuanced behavior. That interpretation was strengthened by reports of surging self-custody flows off Iranian exchanges following the strikes, underscoring Bitcoin’s utility as a portable, censorship-resistant asset during periods of capital-flight necessity, echoing similar behavior observed during the Russia–Ukraine conflict in 2022 and the US regional banking crisis in 2023.
Looking further ahead, history suggests that if the conflict drags on, the response may ultimately shift toward hard assets. Every major US military engagement in the Middle East has eventually coincided with direct spending, deficit expansion, or monetary accommodation. If this situation persists without resolution, the pressure to provide more accommodative policy is likely to rise, even in the face of elevated inflation risk. In that environment, Bitcoin’s hedge thesis is likely to strengthen, rather than fade.
What are the technicals telling us?
Spot analysis: 50- and 200-day moving averages
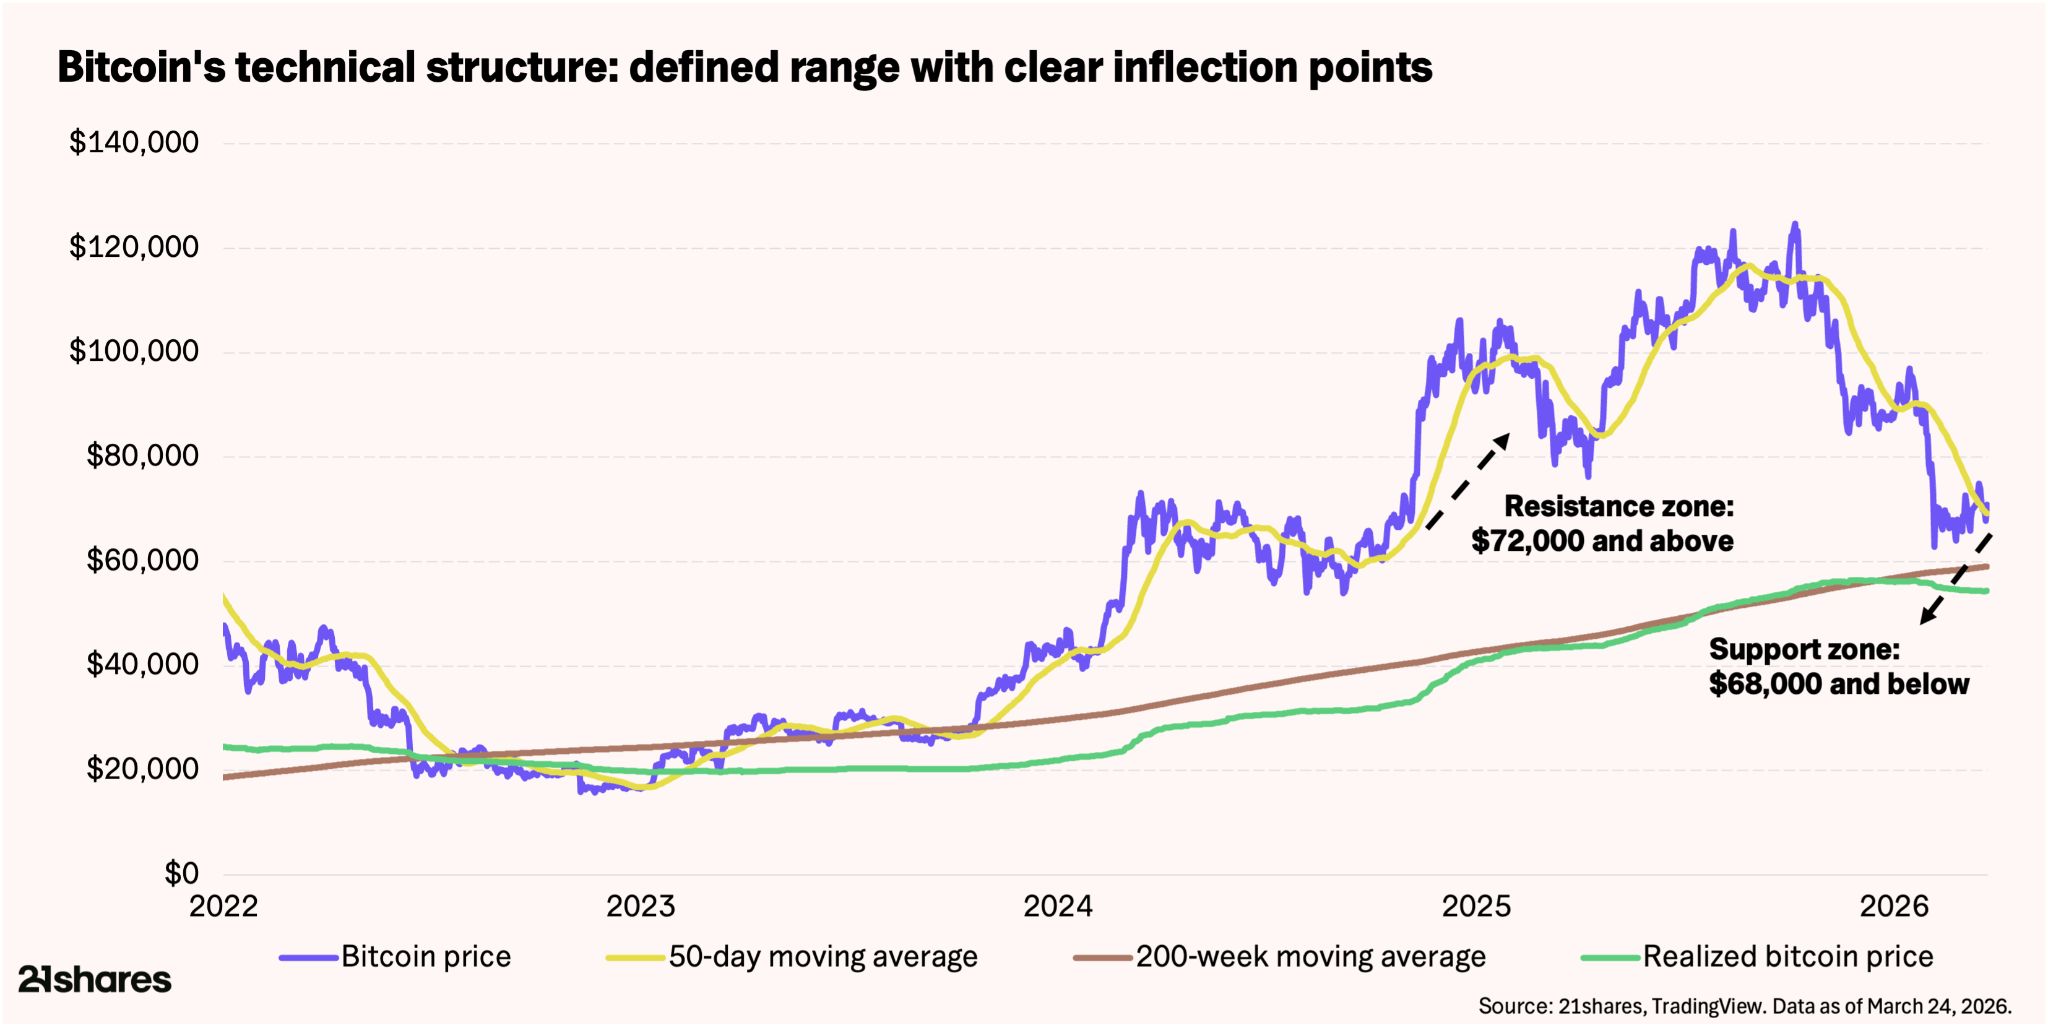
Trading slightly above $69,000, bitcoin remains below its 200-day moving average (DMA) at $91,000 - the 200 DMA will prove to be a resistance point bitcoin must overcome in the long run. However, the immediate focus is the 50 DMA ($68,879).
Historically, retaking this level serves as support for multi-month uptrends, which eventually lead to overtaking the 200 DMA. This has occurred as recently as February 2024, October 2024, and April 2025, with each instance acting as a launchpad for new all-time highs. For a shift in momentum, Bitcoin must treat the 50-day MA as a firm floor, providing the foundation needed to eventually challenge the overhead 200-day MA resistance.
Derivatives and broader positioning
In the bitcoin options market, downside hedging persists below $60,000, but overall positioning is starting to lean bullish.
- Open interest (OI) put/call ratio of 0.67, meaning there are roughly two calls for every three puts, a sign that traders are positioning for upside.
- However, the volume put/call ratio is 1.24, indicating that puts are still being traded more frequently on a day-to-day basis.
A look through the TradFi lens tells a clearer story. US Bitcoin ETF options are heavily skewed toward calls in the April 24 contract, with a put/call volume ratio of 0.48 and open interest of 0.55. Significant open interest is concentrated in the $75,000-$80,000 range, reflecting a structural long bias among institutional participants.
Max pain, the price level where the most options contracts expire worthless, reinforces this picture. It matters because the institutions that sell these contracts actively hedge their positions, which tends to push the price toward that level as expiry approaches. Think of it as a magnet for price in the days leading up to settlement. That magnet has been moving higher:
- In February, the max pain level sat in the low $60,000s.
- Today, it is around the $75,000 level.
- Looking into Q2, it trends toward $80,000, roughly 10-15% above where Bitcoin trades now.
- The nearest test is this Friday, March 28, when $14.16 billion in options expire, representing 40% of total open interest. With max pain at $75,000, there is a strong chance price drifts toward that level before the weekend.
More structurally, market positioning has undergone a significant reset. The 2026 year-to-date OI average of $33 billion represents a more than 25% contraction from the $45 billion average seen throughout 2025. This reduction in leverage underscores a cleaner environment, reducing fragility and confirming that the current price action is supported by a more sustainable foundation.
Technical structure: defined range with clear inflection points
With Bitcoin trading around $69,000, price action has solidified a structural framework anchored by prior cycle highs and high-volume consolidation zones, notably flipping the $68,000–$70,000 supply zone into a foundational support floor.
For long-term capital allocators, these levels matter the most:
Key support zones
- $60,000–$65,000: structural range support: A high-volume consolidation node from 2024, aligning with the 2021 cycle all-time high – both a technical and psychological level.
Key resistance levels
- $72,000–$74,000: “Liberation Day” (April 2025) breakdown zone: Reclaiming this area would signal stabilization rather than continued distribution.
- $74,000–$76,000: March 2026 resistance zone: Primary overhead resistance throughout March, finding confluence with support levels from early 2025's Trump Tariff Tantrum.
- $80,000–$85,000: Trend confirmation zone: Sustained acceptance above $80,000 would indicate stabilization; above $85,000 would confirm the panic-driven phase has resolved.
Long-term valuation anchor back in focus
Bitcoin still continues to trade near its aggregated investor cost basis and the 200-week moving average, a region where Bitcoin has historically traded less than 5% of the time.
With leverage reduced, derivatives markets cleaner, and long-term holders intact, current levels remain a historically attractive accumulation zone.
What are the silver linings?
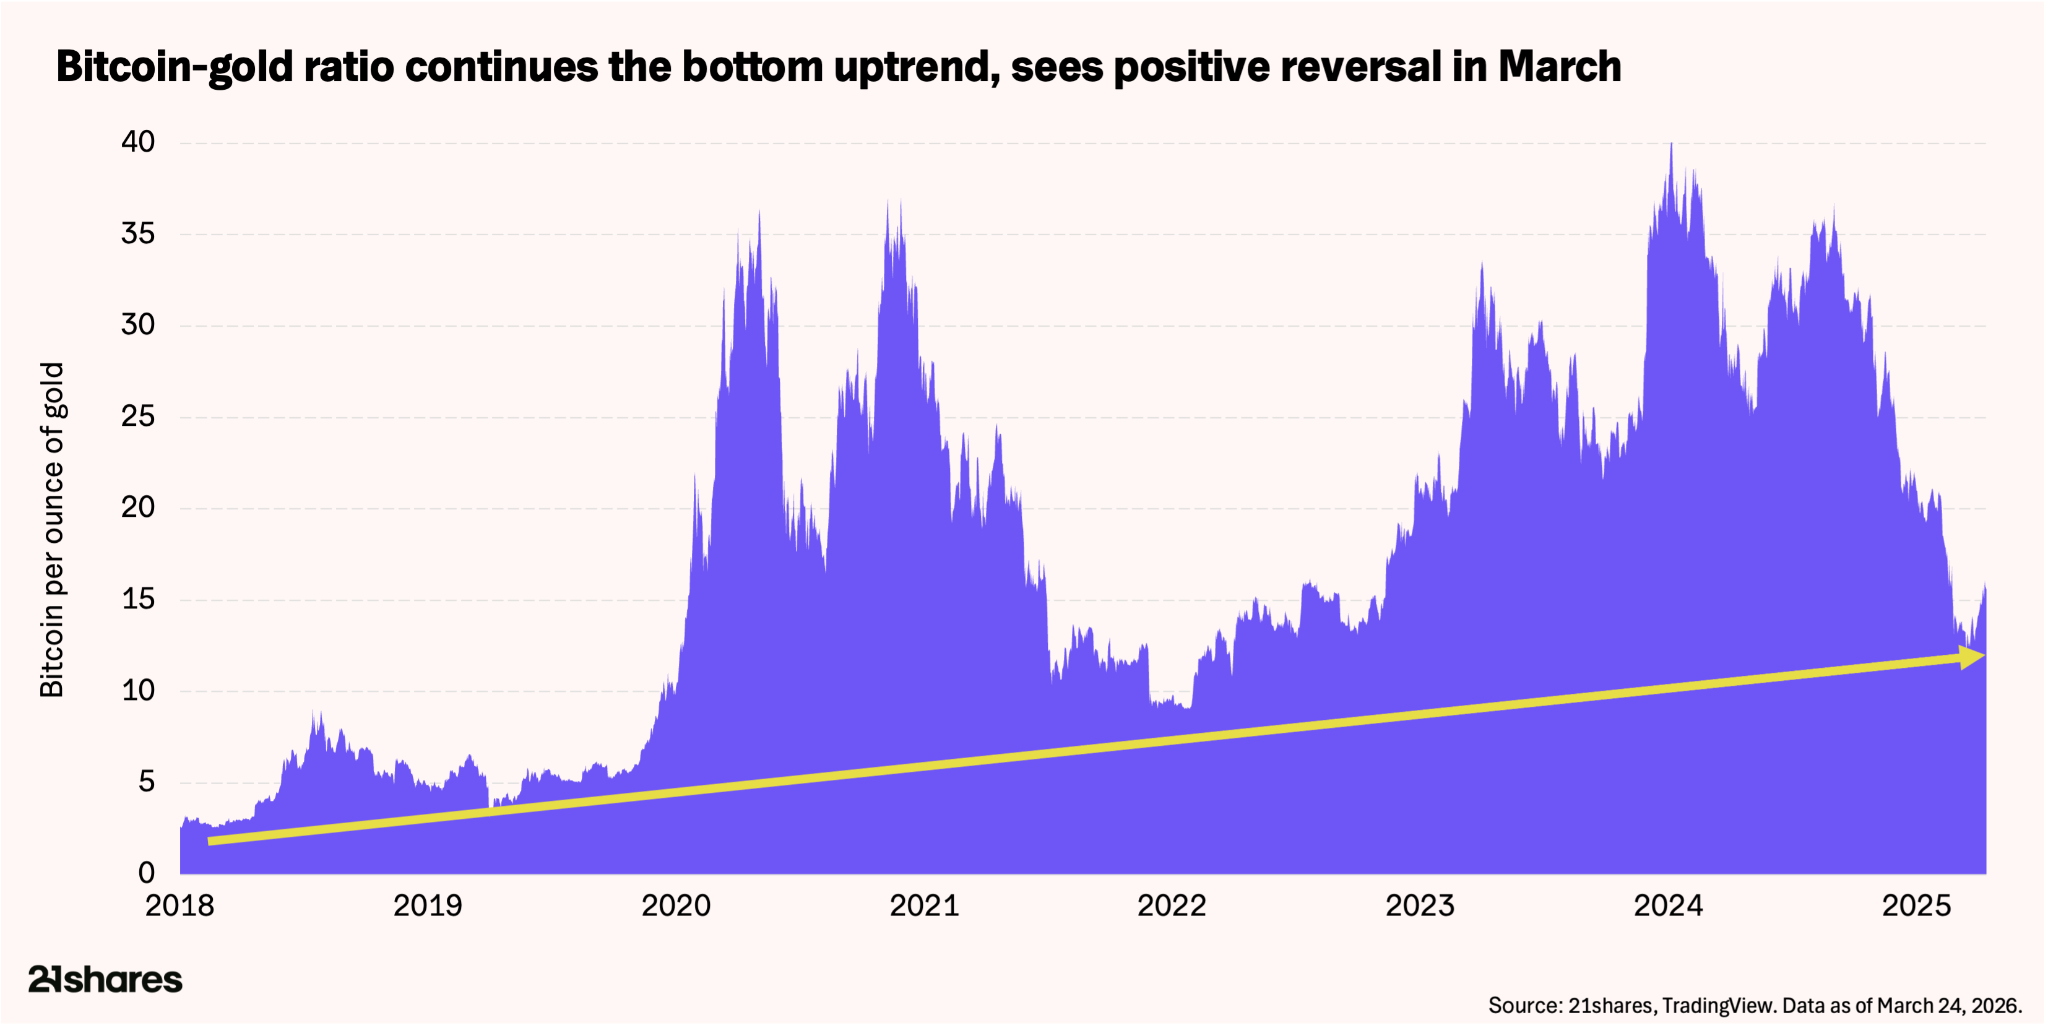
1) Bitcoin as a geopolitical hedge & the reversal in the BTC:Gold ratio
March combined two narratives we had been tracking separately into one: Bitcoin's favorable reaction to Operation Epic Fury, and a violent structural pivot in the BTC:Gold ratio.
On the reaction front, Bitcoin’s 7% March rally defied precedent, outperforming the S&P 500 (-4%) and gold (-17%) during Operation Epic Fury. This decoupling stems from seller exhaustion, renewed ETF inflows, and Bitcoin’s utility as a borderless, censorship-resistant hedge. While Trump hints at de-escalation, Polymarket prices a June ceasefire at 59% and April Hormuz normalization at 27%; any formal resolution remains a major catalyst for the next leg higher.
On the ratio front, the BTC:Gold ratio found a structural floor at ~12.4x following the onset of Operation Epic Fury before recovering 30% to reach 16x by late March, reversing a 13-month decline. That decline has historically coincided with major Bitcoin market bottoms, suggesting positioning may already be largely reset. Further, the subsequent recovery should not be read purely as Bitcoin displacing gold as a traditional safe haven. Rather, it reflects a growing recognition of Bitcoin’s role as a permissionless, borderless rail for moving capital – especially when conflict disrupts traditional financial channels
As geopolitical risk persists, this distinction between storing value and moving it becomes more relevant. For allocators, that functional utility may ultimately matter more than whether Bitcoin fits the conventional safe-haven label.
2) Capital stickiness: ETF suite records third week of inflows
March signaled a definitive reversal for US spot Bitcoin ETFs, which recorded ~$1.6 billion in net inflows, effectively reversing the consecutive outflows seen in January and February. Total assets reached $90 billion – absorbing 6% of Bitcoin’s market cap – with YTD outflows narrowing to just $210 million. This stabilization suggests a renewed institutional appetite as regulated capital seeks long-term exposure amidst ongoing geopolitical decoupling.
Complementing sticky ETF capital is DAT capital. Strategy’s recently announced over $44 billion ATM program creates a structural demand floor, absorbing sell pressure through programmatic buying. After growing its holdings by 50% (+263,000 BTC) last year, Strategy now holds 762,099 BTC ($54 billion) – serving as a primary stabilizer and long-term valuation anchor for the entire asset class.
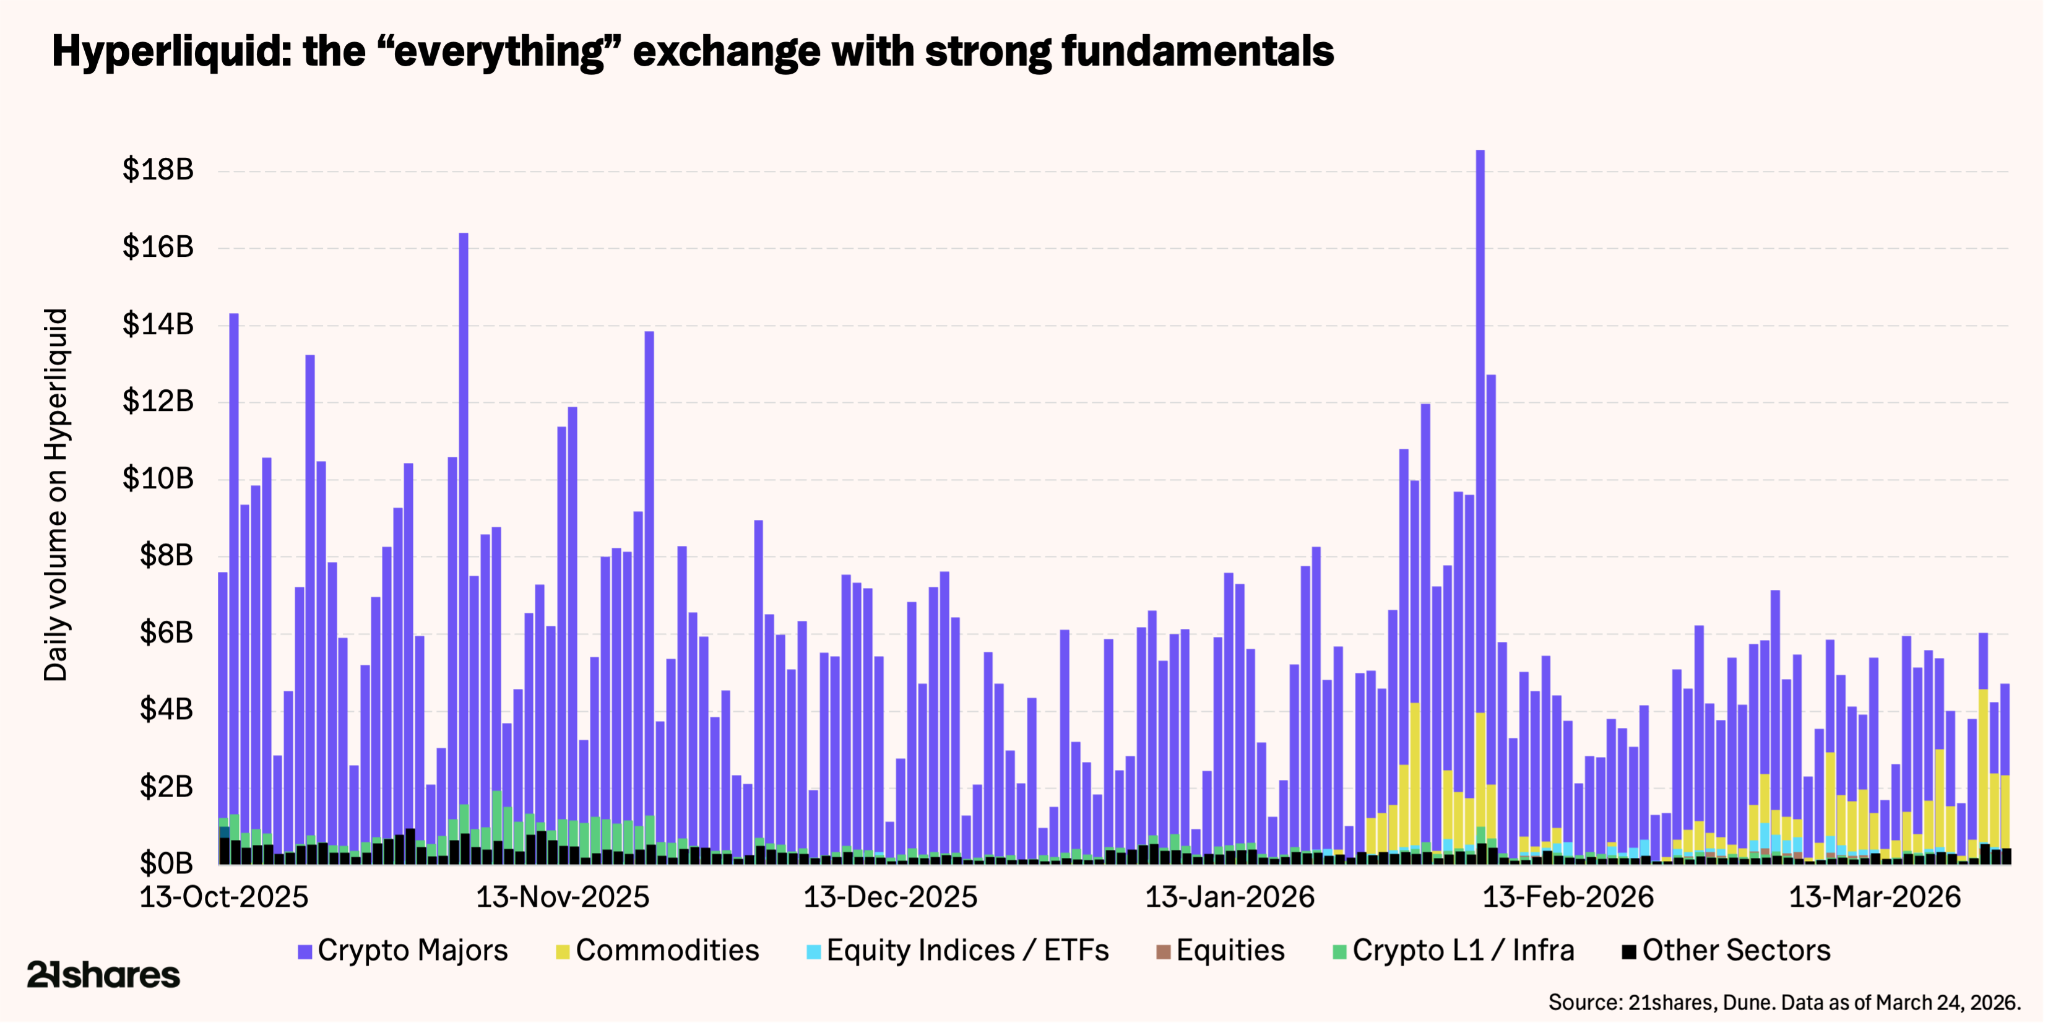
3) Hyperliquid: the “everything” exchange with strong fundamentals
Hyperliquid has pivoted from a crypto-native venue into a diversified exchange. Driven by geopolitical shocks in 2026, non-crypto assets now comprise 30% of total volume - an 800% increase since late 2025. With oil perpetuals hitting $8 billion in weekly volume and total Hyperliquid monthly volumes exceeding $200 billion, Bloomberg now cites Hyperliquid’s order books for weekend commodity pricing.
Hyperliquid’s 24/7/365 crypto-rails price geopolitical shocks days ahead of traditional markets, serving as a primary volatility index while traditional exchanges are closed. The protocol’s efficiency is staggering:
- $873 million in 2025 revenue with only 11 employees yields $79 million per staff member, dwarfing the CME Group’s $1.7 million.
- Its net deflationary model directs 97% of fees to buybacks (+$800 million total)
- A 10.2x P/R multiple sits well below the CME’s 16-17x.
Traditional Finance validation is also accelerating. S&P Dow Jones Indices licensed3 the S&P 500 to Trade[XYZ] to launch the first officially approved perpetual contract on Hyperliquid, giving eligible non-US investors 24/7 leveraged exposure to the world's most tracked equity benchmark on a decentralized platform. That a company behind trillions in index-linked products actively chose to license its flagship benchmark to onchain infrastructure speaks volumes about where institutional confidence is heading.
HYPE is up 50% YTD, with a low 30% correlation to the broader crypto market, and the upcoming HIP-4 upgrade will introduce options and prediction markets. Applying a CME-like 16–17x revenue multiple implies a bull-case valuation of $19 billion-$24 billion ($80–$100 per HYPE)
For a deeper dive, read our full Hyperliquid research report here.
What are the expected scenarios?
Bull case: stabilization and upside resolution (medium probability)
- Conditions stabilize faster than expected as a potential ceasefire and softening economic data alleviate inflation concerns, driving global yields lower.
- BTC reclaims the $74,000–$76,000 resistance zone, then $80,000, with sustained acceptance confirming a definitive end to the five-month corrective phase.
- Progress on the CLARITY Act provides a catalyst, as reports suggest the stablecoin yield-accrual impasse has been resolved, removing a primary hurdle for broader institutional participation.
Bear case: extended consolidation or renewed downside test (low probability)
- Geopolitical escalation regarding Operation Epic Fury leads to a prolonged closure of the Strait of Hormuz; the resulting energy supply shock spikes headline inflation and reinforces a higher-for-longer rate environment.
- Uncertainty persists, keeping liquidity conditions tight and limiting institutional re-engagement - keeping BTC stuck between $65,000 - $70,000.
- However, a break below $65,000 opens downside toward the $56,000–$58,000 structural floor if mechanical selling resumes and risk appetite continues to contract.
Near-term volatility does not alter our long-term thesis.
March aligned unique catalysts: geopolitical risk acting as a catalyst for Bitcoin, SEC/CFTC regulatory clarity, and a surge in institutional capital. With the five-month losing streak snapped, market health is the cleanest in months – leverage has reset by 25%.
While technicals sit at a crossroads, ETF flows are decisively positive. Future momentum hinges on the Strait of Hormuz, the Fed’s inflation response, and the CLARITY Act’s legislative pace. A breakout foundation is building, but $76,000 remains the critical signal.
______
Footnotes:
- Polymarket. (2026). Clarity Act signed into law in 2026?
- Polymarket. (2026). Strait of Hormuz traffic returns to normal by April 30?
- S&P Global. (2026, March 18). S&P Dow Jones Indices licenses S&P 500® to Trade[XYZ] for perpetual contracts on Hyperliquid.
This report has been prepared and issued by 21Shares AG for publication globally. All information used in the publication of this report has been compiled from publicly available sources that are believed to be reliable, however, we do not guarantee the accuracy or completeness of this report. Crypto asset trading involves a high degree of risk. The crypto asset market is new to many and unproven and may have the potential not to grow as expected.Currently, there is relatively small use of crypto assets in the retail and commercial marketplace in comparison to relatively large use by speculators, thus contributing to price volatility that could adversely affect an investment in crypto assets. In order to participate in the trading of crypto assets, you should be capable of evaluating the merits and risks of the investment and be able to bear the economic risk of losing your entire investment.Nothing herein does or should be considered as an offer to buy or sell or solicitation to buy or invest in crypto assets or derivatives. This report is provided for information and research purposes only and should not be construed or presented as an offer or solicitation for any investment. The information provided does not constitute a prospectus or any offering and does not contain or constitute an offer to sell or solicit an offer to invest in any jurisdiction. The crypto assets or derivatives and/or any services contained or referred to herein may not be suitable for you and it is recommended that you consult an independent advisor. Nothing herein constitutes investment, legal, accounting or tax advice, or a representation that any investment or strategy is suitable or appropriate to your individual circumstances or otherwise constitutes a personal recommendation. Neither 21Shares AG nor any of its affiliates accept liability for loss arising from the use of the material presented or discussed herein.Readers are cautioned that any forward-looking statements are not guarantees of future performance and involve risks and uncertainties and that actual results may differ materially from those in the forward-looking statements as a result of various factors.This report may contain or refer to material that is not directed to, or intended for distribution to or use by, any person or entity who is a citizen or resident of or located in any locality, state, country or other jurisdiction where such distribution, publication, availability or use would be contrary to law or regulation or which would subject 21Shares AG or any of its affiliates to any registration, affiliation, approval or licensing requirement within such jurisdiction.
.png)