How to value Solana


Valuing crypto assets is becoming more advanced. In the past, prices were often driven by hype and big stories, but now, investors are starting to use more organized methods, similar to those used in traditional finance, to understand what these assets are really worth.
Building on the ideas of Greer and Burniske (the influential voices in the investment world), we see Solana's token, SOL, as a capital asset, meaning it generates ongoing economic value through real activity on its network. As networks like Solana grow into platforms that create revenue, traditional ways of valuing assets become not just useful but necessary.
This report applies that perspective to Solana, a platform that’s evolving into a tech infrastructure company powering the next wave of decentralized applications. It can now be analyzed, benchmarked, and valued like any other tech company. By the end, you'll have a better understanding of what drives SOL’s valuation and where the market might still be misjudging its worth.
Intrinsic valuation: Solana as a revenue-generating business
At the heart of Solana’s valuation lies its ability to generate tangible, recurring economic rewards. Much like a dividend-paying stock, the network delivers value to validators through two primary streams:
- Network issuance: New SOL is periodically minted and distributed as a reward for securing the network.
- Transaction fees: Every transaction on Solana is settled in SOL, with a portion allocated to validators as protocol income.
These mechanisms place SOL at the center of Solana’s economic engine, fueling activity and distributing value. In 2024 alone, this translated into $1.44 billion in validator rewards. With 2025 already outpacing that figure, we apply a conservative 100% YoY growth projection, accounting for shifts like SIMD-0096 (Solana Improvement Document that proposes rewarding validators with 100% of priority fees instead of the previous 50/50 split) and the normalization of on-chain activity. As the usage of applications increases, the revenue generated by validators also rises.
To quantify this momentum, we turn to a Discounted Cash Flow (DCF) model, a method widely used in equity markets to estimate an asset’s fair value based on expected future earnings.
Figure 1 – Solana’s discounted cash flow

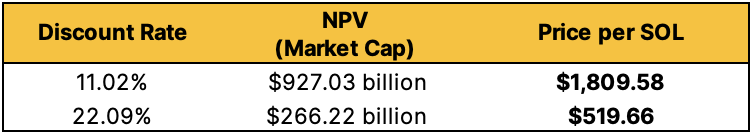
Source: 21Shares, Coingecko, Dune. Data as of March 31, 2025
Even under conservative assumptions, the results are striking: our model suggests SOL is significantly undervalued, projecting over 10x upside at lower discount rates, and a more than 3x upside even at the higher end. While DCFs may not capture every nuance of crypto dynamics, they offer a valuable lens on Solana’s expanding cash flows. As its fee base continues to diversify, Solana’s valuation is increasingly tied not just to speculation but to its underlying economic output.
Relative valuation: How Solana stacks up against its peers
While Solana’s fundamentals make a strong case on their own, valuation doesn’t exist in a vacuum. To understand its standing, we compare Solana to Layer 1 peers that serve similar functions, powering applications, securing value, and acting as foundational blockchain infrastructure. These peers include Ethereum, BNB Chain, Avalanche, and TON.
We focus on two standardized multiples: price-to-sales (P/S) and price-to-earnings (P/F). Both are calculated using the fully diluted market cap to ensure total token issuance is accounted for, which is critical in crypto, where supply unlocks can significantly affect valuation.
Solana stands out immediately. Its P/F ratio sits at just 165, by far the lowest among major Layer 1s. That compares to 708 for Ethereum, 1,828 for Avalanche, and over 2,000 for TON.
Figure 2 – Comparing price-to-fees ratios across major Layer 1 blockchains
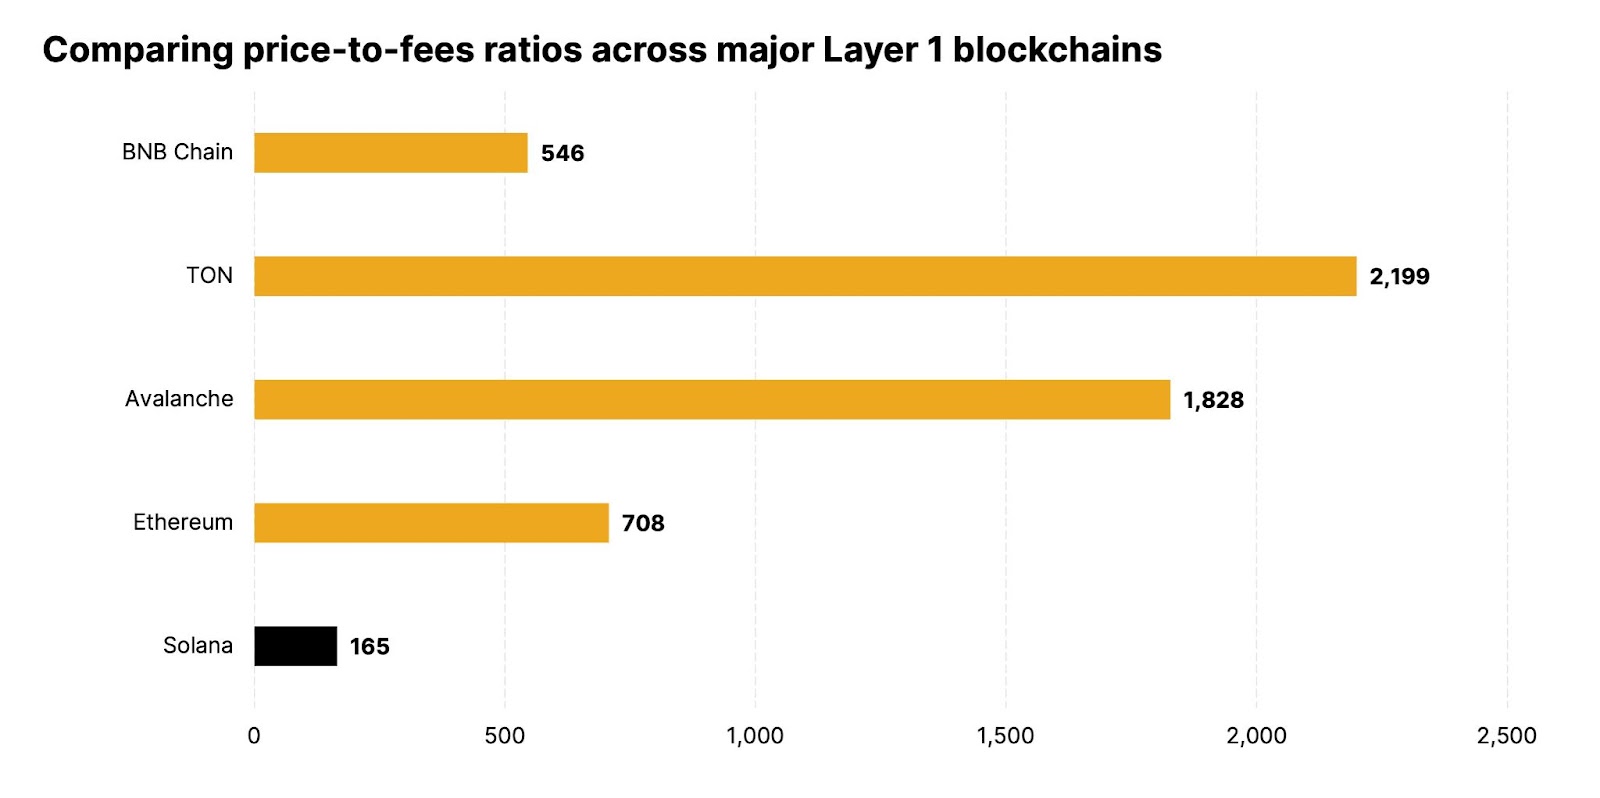
Source: 21Shares, TokenTerminal. Data as of May 26, 2025
While its P/S ratio, at 1,906, is slightly higher, it is still well below peers like BNB Chain (5,413) and TON (4,398) and remains in line with Avalanche and Ethereum.
Figure 3 – Comparing price-to-sales ratios across major Layer 1 blockchains
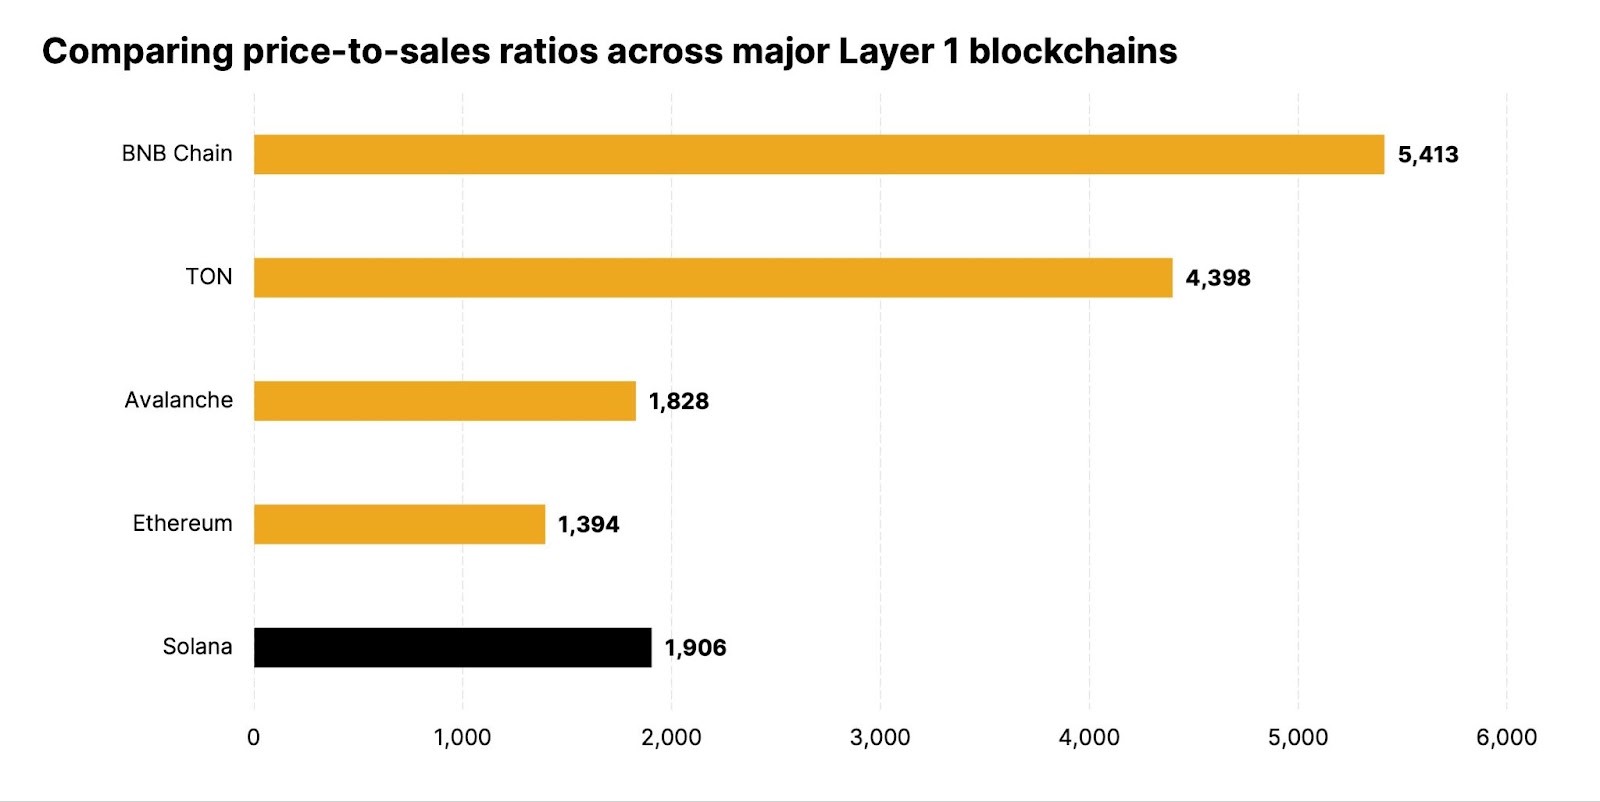
Source: 21Shares, TokenTerminal. Data as of May 26, 2025
These compressed multiples highlight a key insight: Solana is processing real on-chain activity, with robust fee generation that reflects genuine demand for blockspace. While not all fees are retained by the protocol, the throughput alone speaks to the network’s economic vitality.
Figure 4 – Comparing price-to-fees ratios across major Layer 1 blockchains
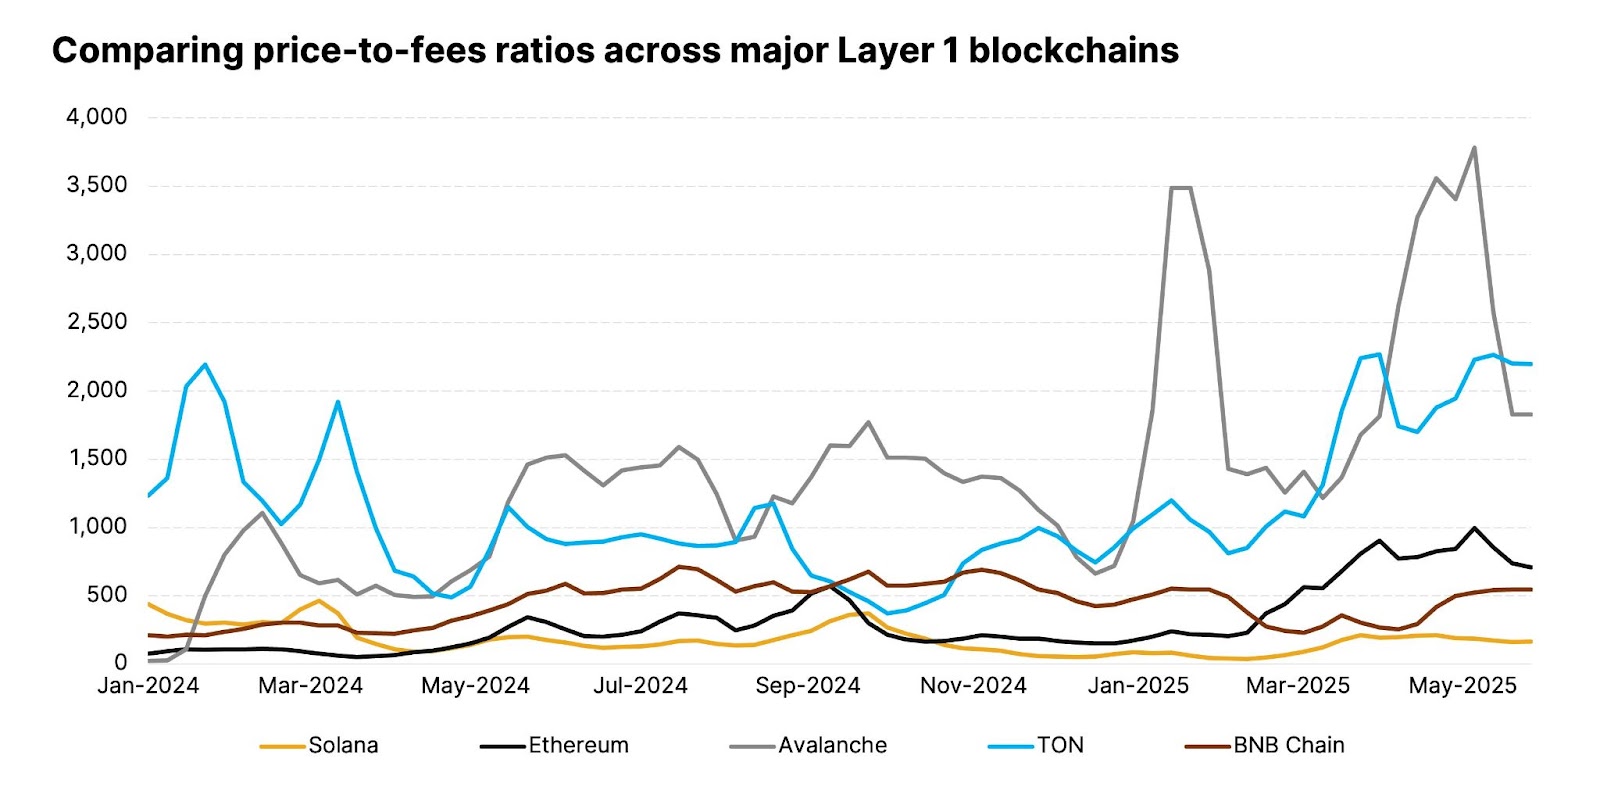
Source: 21Shares, TokenTerminal. Data as of May 26, 2025
Even more compelling, these multiples aren’t just momentary advantages. Historically, Solana has consistently ranked as one of the most attractively valued Layer 1s relative to its activity and revenue. The market continues to underprice just how much utility the network delivers.
Figure 5 – Comparing price-to-sales ratios across major Layer 1 blockchains

Source: 21Shares, TokenTerminal. Data as of May 26, 2025
As token supply comes online and flows into real-world applications, across DePIN, AI, and global payments, Solana’s valuation multiples aren’t just expected to compress; they already are. Both P/S and P/F ratios have steadily declined in recent years, driven not by falling prices but by rising usage and improved monetization. This sustained trend signals a broader shift: the market is beginning to recognize Solana’s growing role as a high-throughput, revenue-generating platform, with more room to rerate as adoption deepens.
Figure 6 – Tracking Solana’s valuation multiples over time
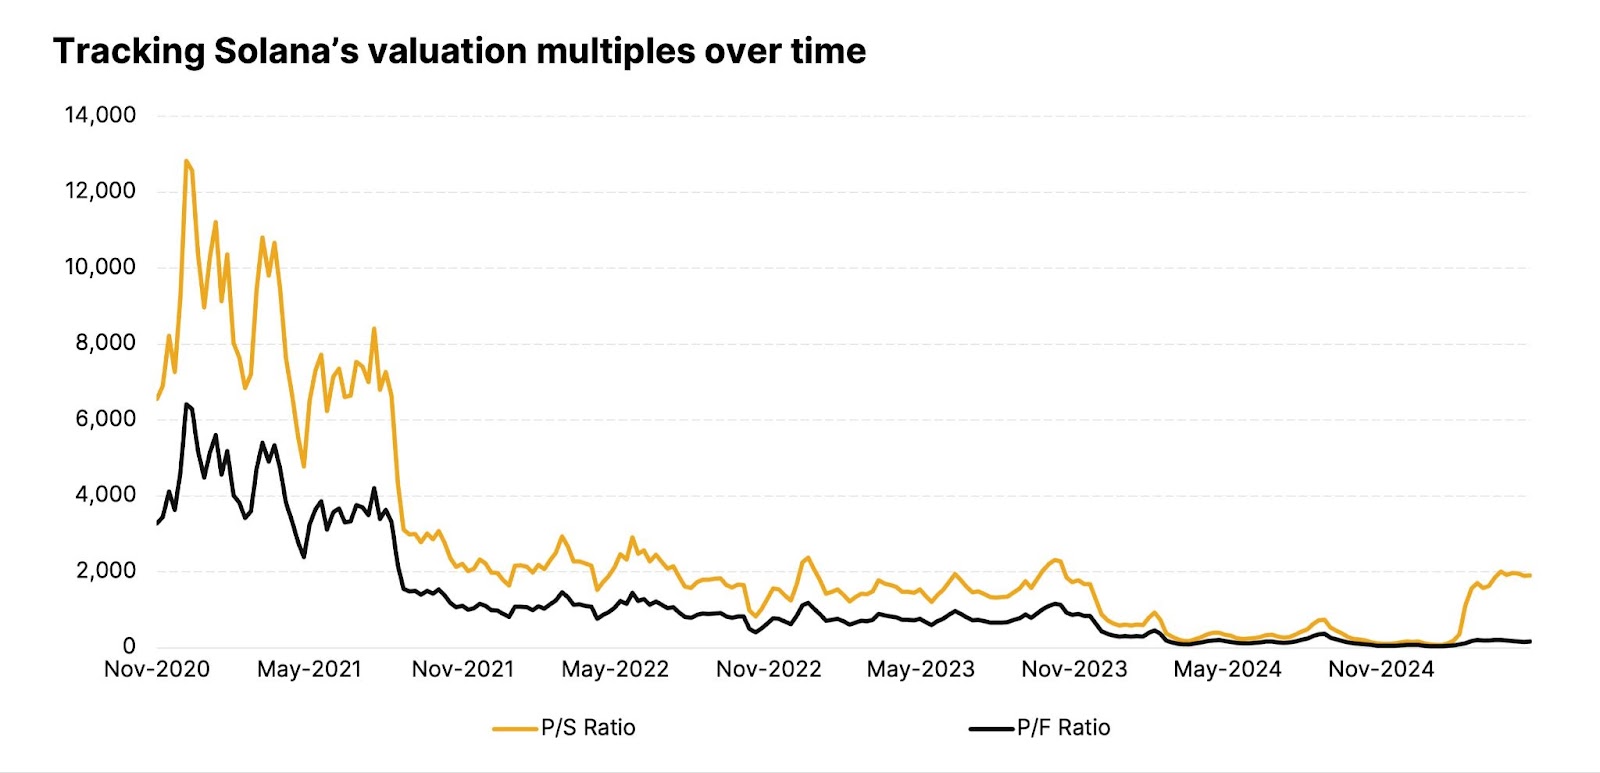
Source: 21Shares, TokenTerminal. Data as of May 26, 2025
TVL efficiency: Unlocking economic utility
While P/S and P/F capture top-line metrics, we also evaluate how efficiently a network puts its capital to work, through TVL-to-market cap and DEX volume per TVL. Total Value Locked (TVL) serves as crypto’s equivalent to assets under management, especially relevant for DeFi ecosystems. A higher TVL-to-market cap ratio often implies deeper investor trust and ecosystem traction. Ethereum leads this metric, thanks to its vast DeFi stack.
Figure 7 – Comparing TVL-to-market cap ratios across major Layer 1 blockchains
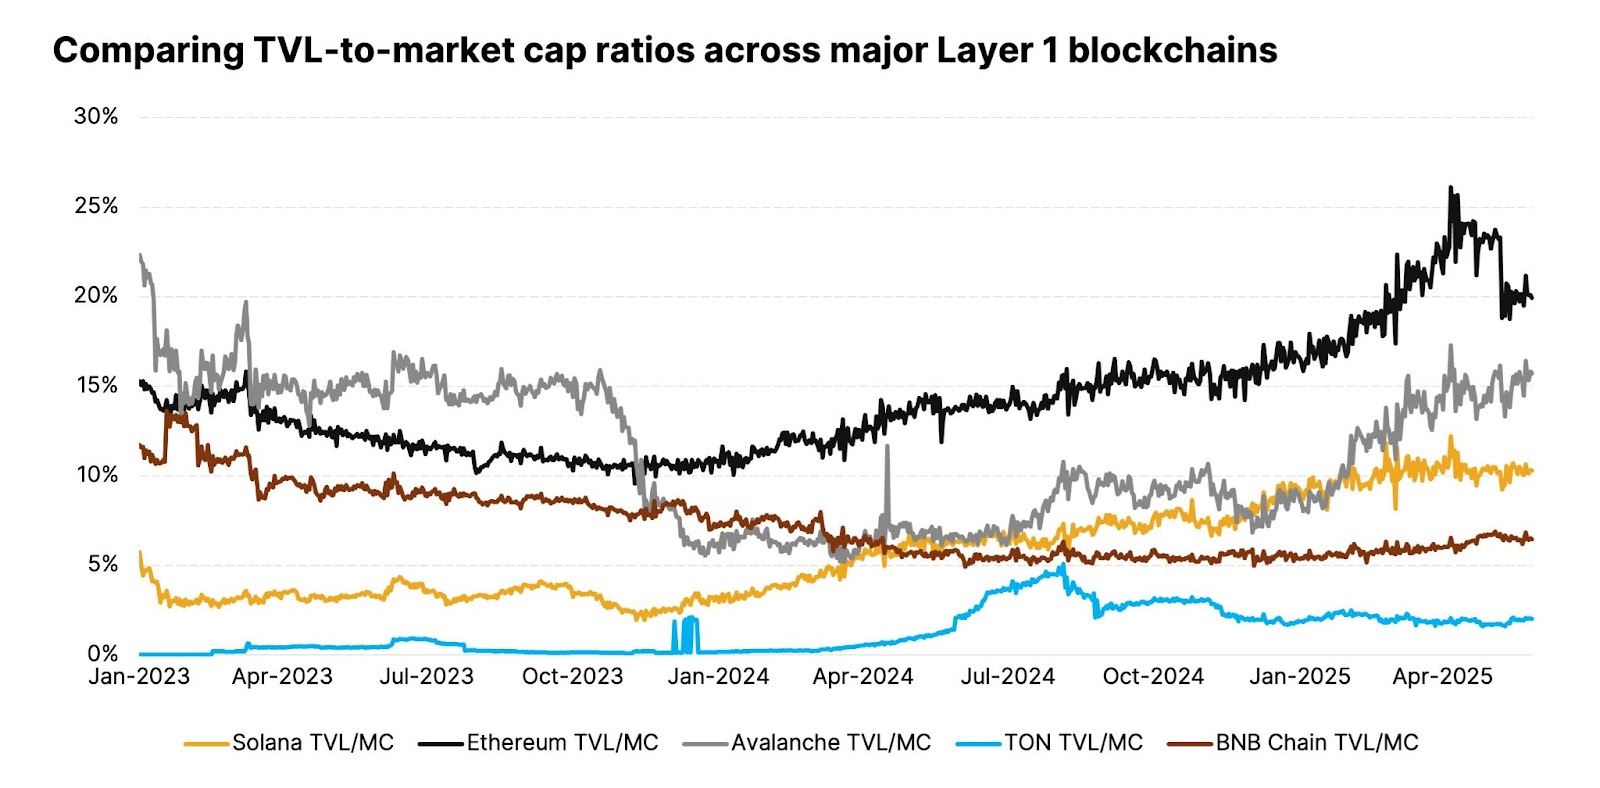
Source: 21Shares, Artemis. Data as of May 26, 2025
Solana, by contrast, sits more mid-pack. But this doesn’t imply low utility. Many of Solana’s most popular use cases don’t require significant locked capital. Within this broader economic context, Solana’s TVL-to-market cap ratio remains healthy. What’s more important is the trajectory: since the FTX collapse in late 2022, Solana’s TVL/MC ratio has climbed steadily, signaling renewed confidence and increased capital deployment into its DeFi ecosystem.
Figure 8 – Tracking Solana’s TVL-to-market cap over time
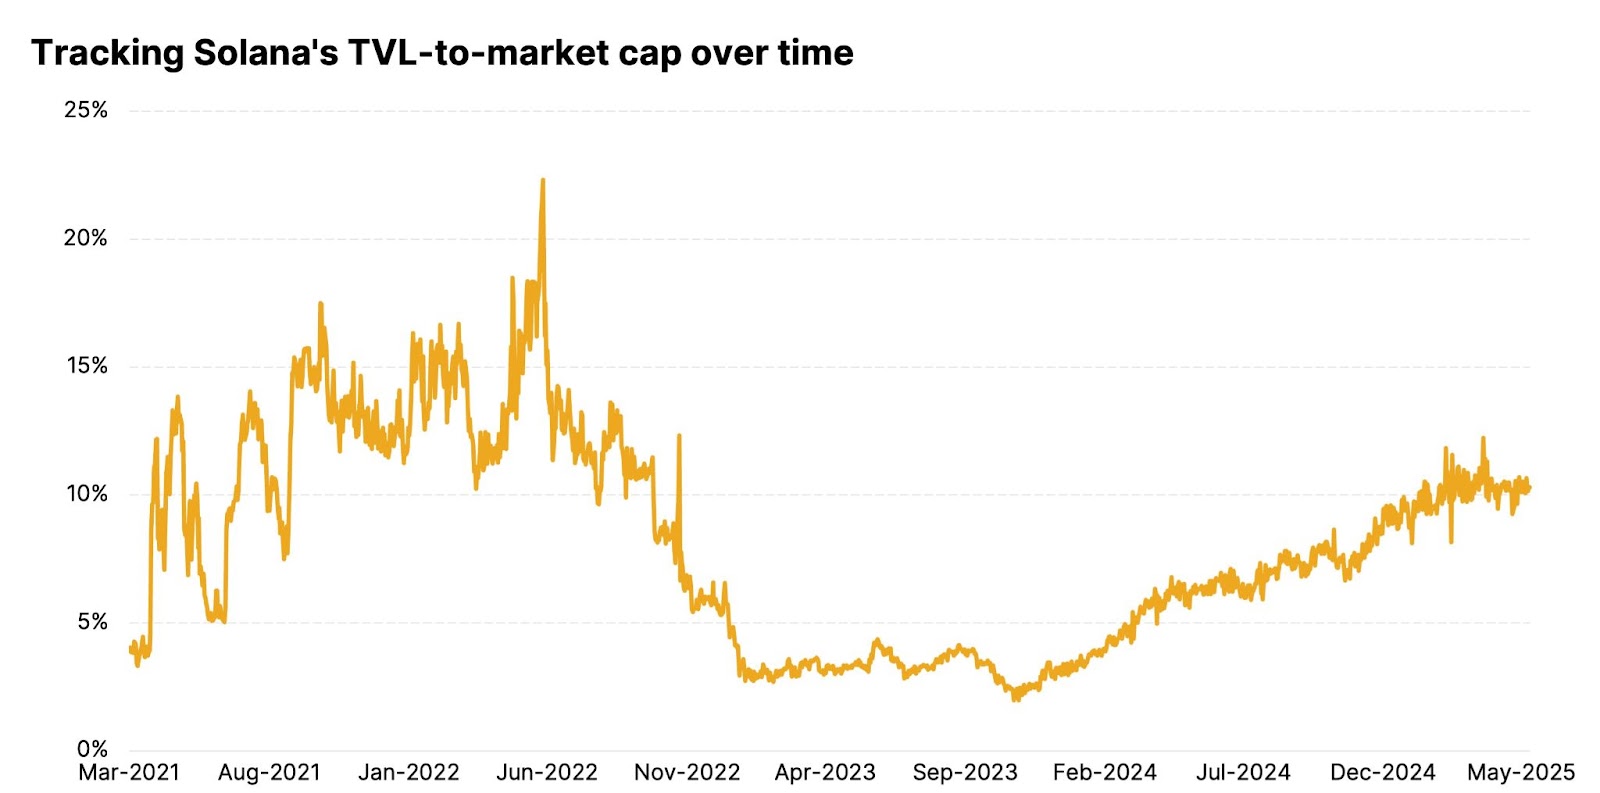
Source: 21Shares, Artemis. Data as of May 26, 2025
But perhaps the most revealing metric isn’t how much capital is locked, it’s how actively that capital is used. By comparing 12-month DEX volume per $1 of TVL, we measure throughput per unit of capital. And here, Solana dominates. This level of efficiency underscores Solana’s real strength: it’s not just attracting capital, it’s putting it to work. The result is outsized economic activity on a leaner capital base, positioning Solana as a chain designed for real usage thanks to its high throughput and low friction.
Figure 9 – Comparing DEX volume per $ of TVL across major Layer 1 blockchains
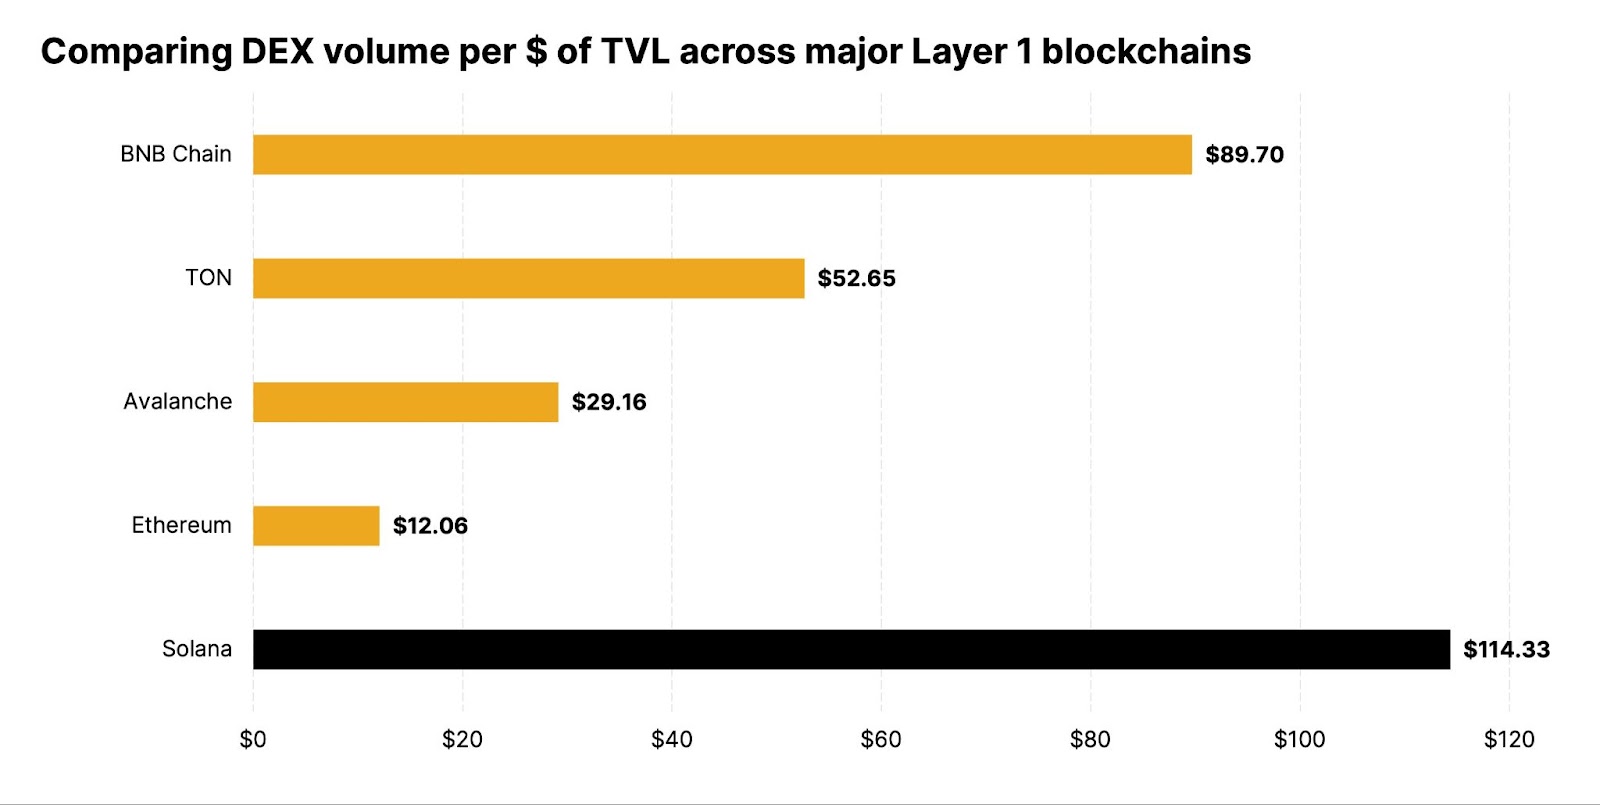
Source: 21Shares, Tokenterminal. Data as of May 26, 2025.
Market sizing: Where does Solana fit among its competitors?
No single metric tells the full story, but viewed together, Solana’s valuation profile presents a compelling case. Across price-to-fees, price-to-sales, TVL efficiency, and DEX volume per dollar of TVL, one theme stands out: Solana is driving real economic activity, yet its network is still valued at a significant discount compared to its peers.
Crypto is an evolving asset class, and Solana, despite its momentum, still faces challenges that could influence its trajectory.
- Competition: Growing competition from efficient Layer 2 solutions, such as Base, and new Layer 1 blockchains like Sui and TON presents a challenge for Solana. In response, Solana is introducing Firedancer, a second validator client that aims to increase throughput beyond 1 million transactions per second and enhance execution resilience.
- Validator centralization: Solana has more validators than most blockchains, but remains less decentralized than Ethereum due to costly hardware. To broaden validator participation, the Solana Foundation is easing onboarding via subsidies and a revamped delegation program.
- Reputational risk: Speculative activity concentration, with memecoins making up a large portion of the volume, presents a challenge for Solana. To address this issue, ecosystem funds are increasingly supporting projects focused on utility, particularly in areas like decentralized physical infrastructure networks (DePIN) and artificial intelligence (AI).
- Lack of client diversity: Solana's validator ecosystem lacks adequate client diversity. The introduction of alternative clients, such as Firedancer, aims to reduce single points of failure and enhance network reliability.
- Inflation concerns: Inflation dynamics, particularly following SIMD-0096. Ongoing governance proposals are exploring dynamic emissions models to maintain sustainable tokenomics.
Despite challenges, Solana’s core advantages continue to strengthen. Its upside potential becomes clearer when compared to Ethereum.
Today, Solana trades at roughly one-third of Ethereum’s market cap, despite rapidly narrowing the gap in usage and economic output. While a full "flippening" may not be imminent, Solana’s trajectory suggests meaningful convergence is possible.
If Solana were to reach just 50% of Ethereum’s market cap, its implied price would rise to $316, nearly a 2x from today. At full parity, the target exceeds $630. These aren’t price predictions, but directional benchmarks, useful markers for understanding how the market could evolve as Solana scales. With clear execution, expanding adoption, and demonstrable traction across verticals, Solana is increasingly positioned not just as an Ethereum alternative but as a foundational pillar in the next generation of the crypto economy.
Figure 10 – Projected SOL price at various % of Ethereum’s market cap
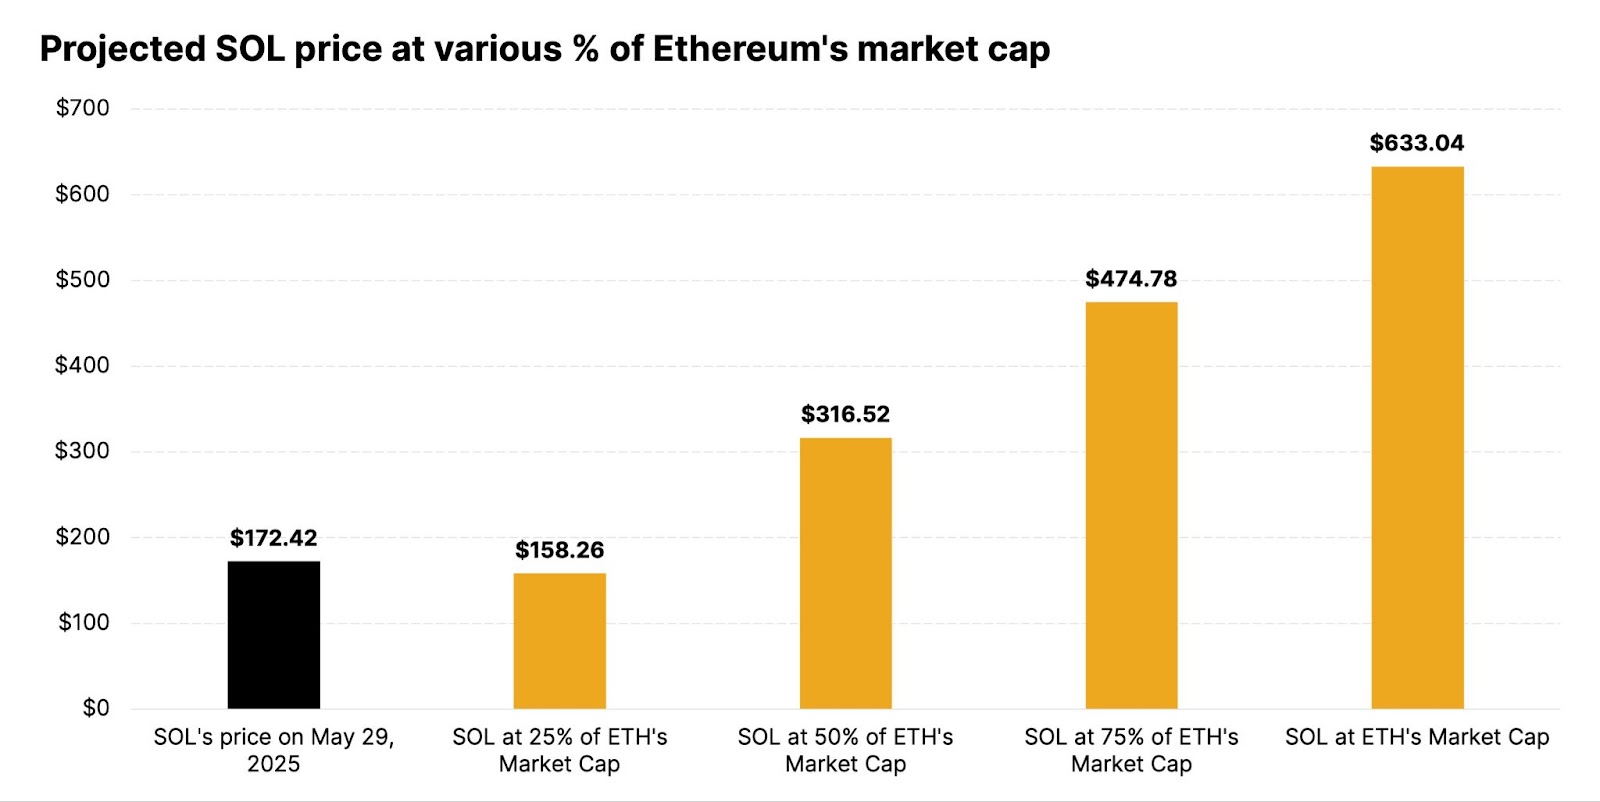
Source: 21Shares, Coingecko. Data as of May 29, 2025.
This report has been prepared and issued by 21Shares AG for publication globally. All information used in the publication of this report has been compiled from publicly available sources that are believed to be reliable, however, we do not guarantee the accuracy or completeness of this report. Crypto asset trading involves a high degree of risk. The crypto asset market is new to many and unproven and may have the potential not to grow as expected.Currently, there is relatively small use of crypto assets in the retail and commercial marketplace in comparison to relatively large use by speculators, thus contributing to price volatility that could adversely affect an investment in crypto assets. In order to participate in the trading of crypto assets, you should be capable of evaluating the merits and risks of the investment and be able to bear the economic risk of losing your entire investment.Nothing herein does or should be considered as an offer to buy or sell or solicitation to buy or invest in crypto assets or derivatives. This report is provided for information and research purposes only and should not be construed or presented as an offer or solicitation for any investment. The information provided does not constitute a prospectus or any offering and does not contain or constitute an offer to sell or solicit an offer to invest in any jurisdiction. The crypto assets or derivatives and/or any services contained or referred to herein may not be suitable for you and it is recommended that you consult an independent advisor. Nothing herein constitutes investment, legal, accounting or tax advice, or a representation that any investment or strategy is suitable or appropriate to your individual circumstances or otherwise constitutes a personal recommendation. Neither 21Shares AG nor any of its affiliates accept liability for loss arising from the use of the material presented or discussed herein.Readers are cautioned that any forward-looking statements are not guarantees of future performance and involve risks and uncertainties and that actual results may differ materially from those in the forward-looking statements as a result of various factors.This report may contain or refer to material that is not directed to, or intended for distribution to or use by, any person or entity who is a citizen or resident of or located in any locality, state, country or other jurisdiction where such distribution, publication, availability or use would be contrary to law or regulation or which would subject 21Shares AG or any of its affiliates to any registration, affiliation, approval or licensing requirement within such jurisdiction.


.svg)