Frühjahrsputz: Bitcoin testet den Regimewechsel

Analyse von Maximiliaan Michielsen und Stephen Coltman
Der April brachte die stärkste monatliche Performance von Bitcoin seit über einem Jahr, mit einem Anstieg von rund 12% auf etwa 79.500 USD, während sich das geopolitische Umfeld vom Konflikt hin zu vorsichtiger Deeskalation verschob. Die Bewegung testete das von uns kürzlich identifizierte Widerstandsniveau bei 78.000 USD, getrieben durch geduldige Kapitalzuflüsse, ein verbessertes geopolitisches Umfeld und eine Risk On Rally an den Aktienmärkten.

Trotz der Dynamik bleibt dies jedoch eine Bärenmarktrally und kein bestätigter Regimewechsel. Das aktuelle Niveau fungiert weiterhin als Widerstand. Das makroökonomische Umfeld hat sich noch nicht vollständig geklärt. Die Grundlage verbessert sich, aber eine Trendbestätigung steht noch aus.
Was ist im April passiert?
Das Thema KI kam mit voller Wucht zurück, im Nahen Osten wurde ein Waffenstillstand erreicht, auch wenn die Straße von Hormus geschlossen blieb, und Kevin Warsh ist wieder auf Kurs, als neuer Fed-Vorsitzender bestätigt zu werden.
Der Ausverkauf an den Aktienmärkten im März war schnell vergessen. Starke Zahlen von Intel und TSMC, kombiniert mit der Ankündigung des neuen Modells Mythos von Anthropic, lösten eine deutliche Erholung bei Technologieaktien aus. Der Philadelphia Semiconductor Index stieg innerhalb von vier Wochen um 47% vom Tief Ende März, und der Nasdaq verzeichnete erstmals seit 1992 dreizehn aufeinanderfolgende positive Handelstage, mit einem Anstieg von 19% auf ein neues Allzeithoch. Die zurückgekehrte Risikobereitschaft griff auf verschiedene Anlageklassen über und lieferte den Rückenwind, der Bitcoin im gleichen Zeitraum von 69.000 USD in Richtung 79.500 USD steigen ließ.
Im Nahen Osten kündigten die USA und Iran am 8. April einen zweiwöchigen Waffenstillstand an. Der Ölpreis fiel zunächst, erholte sich aber in der zweiten Monatshälfte deutlich, als klar wurde, dass keine dauerhafte Einigung in Sicht ist. Zum Zeitpunkt des Schreibens bleibt die Straße geschlossen, und die Öl-Terminstruktur befindet sich in einer historischen Backwardation, bei der Käufer Rekordprämien für sofortige Lieferung zahlen. Diese Dynamik wirkt weiterhin auf die Inflationserwartungen.
Auf politischer Ebene stellte das Justizministerium die Untersuchung gegen Powell ein und ebnete damit den Weg für Warshs Nominierung. Die Märkte preisen jedoch für den Rest des Jahres 2026 keine Zinssenkungen ein. Das spiegelt die Einschätzung wider, dass der neue Vorsitzende ein Umfeld übernimmt, in dem energiegetriebene Inflation kaum Spielraum für Lockerungen lässt und das Higher for Longer Umfeld bestätigt, das die makroökonomische Obergrenze im Jahr 2026 geprägt hat.
Die US Wirtschaft startete solide in das zweite Quartal. Das Wachstum im ersten Quartal lag bei etwa 2% auf annualisierter Basis. Schwächerer Konsum wurde durch höhere Unternehmensinvestitionen, sinkende Inflation und starke Unternehmensgewinne ausgeglichen. Die Blockade durch Iran und die sich entwickelnde Energiekrise könnten diese Entwicklung jedoch gefährden. Sollte die Straße nicht bald wieder geöffnet werden, droht ein erheblicher Angebotsschock bei wichtigen Rohstoffen. Diese Kombination aus höherer Inflation und niedrigem Wachstum hat sich historisch als negativ für Risikoanlagen erwiesen. Für Bitcoin bleibt die zentrale Frage, ob er diese Belastungen weiterhin absorbieren kann wie im März und April oder ob ein erneuter Ölpreisanstieg zu einem Rückschlag führt.
Gründe, die die Kursentwicklung von Krypto stützen
Ein vorsichtig deeskalierender Ton
Der geopolitische Ton im April unterschied sich deutlich vom März. Statt weiterer Eskalation war der Monat von ersten ernsthaften Gesprächen über Lösungen geprägt. Die Wahrscheinlichkeiten auf Polymarket für ein Friedensabkommen zur Jahresmitte stiegen zeitweise über 80% und lagen damit so hoch wie seit Beginn des Konflikts nicht mehr. Die Märkte reagierten auf die Richtung der Entwicklung und nicht auf das endgültige Ergebnis und preisten ein Szenario ein, in dem sich die Lage verbessert statt weiter verschlechtert.
Vorsicht bleibt dennoch angebracht. Der Ölpreis steigt trotz Waffenstillstandgesprächen weiter, und die bereits entstandenen wirtschaftlichen Schäden werden unabhängig vom Ausgang Zeit brauchen, um sich zu normalisieren. Für Krypto war der veränderte Ton jedoch entscheidend. Er reduzierte die Wahrscheinlichkeit eines weiteren externen Schocks, gab der Risikobereitschaft Raum zur Erholung und ermöglichte es der strukturellen Nachfrage nach Bitcoin, sich zu entfalten, statt durch Schlagzeilenrisiken unterdrückt zu werden.
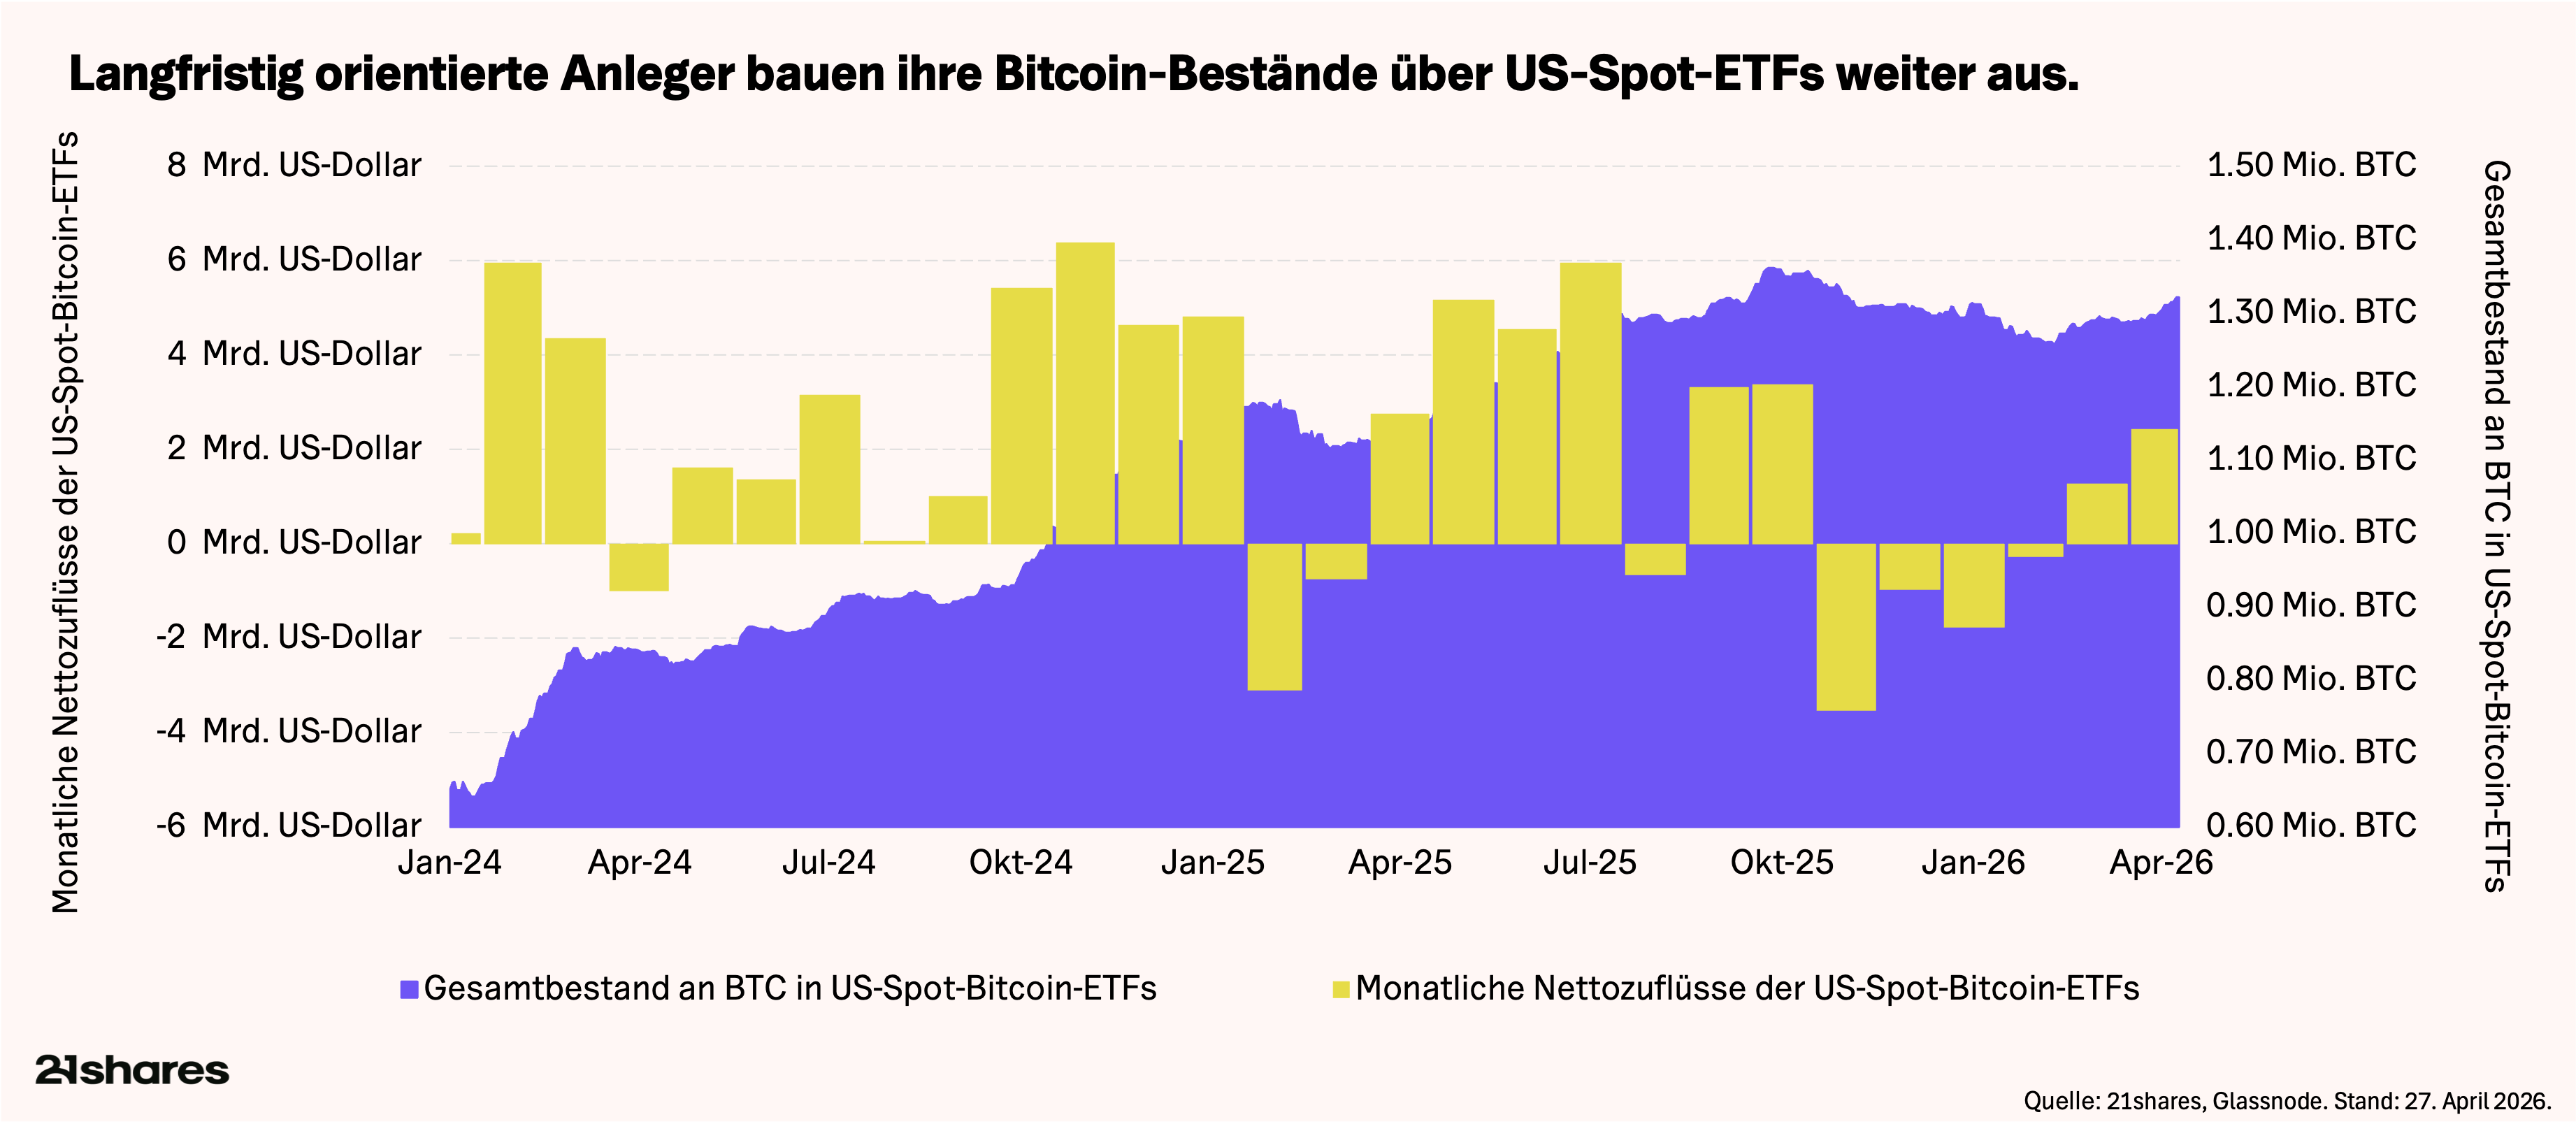
Geduldiges Kapital akkumuliert weiter Bitcoin
Die Kapitalflüsse liefern das klarste Signal dafür, dass diese Korrektur von den wichtigsten Marktteilnehmern als Kaufgelegenheit genutzt wird.
US Spot Bitcoin ETFs verzeichneten im April Nettozuflüsse von rund 2,4 Milliarden USD und damit den stärksten Monat seit dem Crash im Oktober des Vorjahres. Die gesamten ETF Bestände liegen nun bei etwa 1,31 Millionen BTC und bewegen sich in Richtung neuer Höchststände, obwohl der Preis weiterhin über 40% unter dem Hoch von 2025 liegt.
Auch Unternehmensbilanzen bleiben ein starker Treiber. Strategy tätigte den drittgrößten Bitcoin-Kauf seiner Geschichte, 34.164 BTC für rund 2,54 Milliarden USD, womit die Bestände auf über 815.000 BTC stiegen. Die Finanzierung erfolgt zunehmend über bevorzugte Instrumente wie STRC, das seit dem Start über 2,1 Milliarden USD eingesammelt hat. Diese Art von großskaliger Nachfrage gab es in früheren Zyklen nicht.
Parallel dazu erweitert sich das institutionelle Produktangebot weiter. Goldman Sachs reichte einen Antrag für einen Bitcoin Premium Income ETF ein, Morgan Stanley machte Spot Krypto für rund 16.000 Berater zugänglich, und ein renditefokussierter Bitcoin ETF von BlackRock wird in Kürze erwartet. Dadurch entsteht eine Marktstruktur, die sich grundlegend von früheren Zyklen unterscheidet. Stabilere Hände, weniger reflexartige Verkäufe und eine wachsende Basis institutioneller Käufer mit mehrjährigen Anlagehorizonten. Geduldiges Kapital baut das Fundament, auf dem eine Bestätigung letztlich entstehen wird.
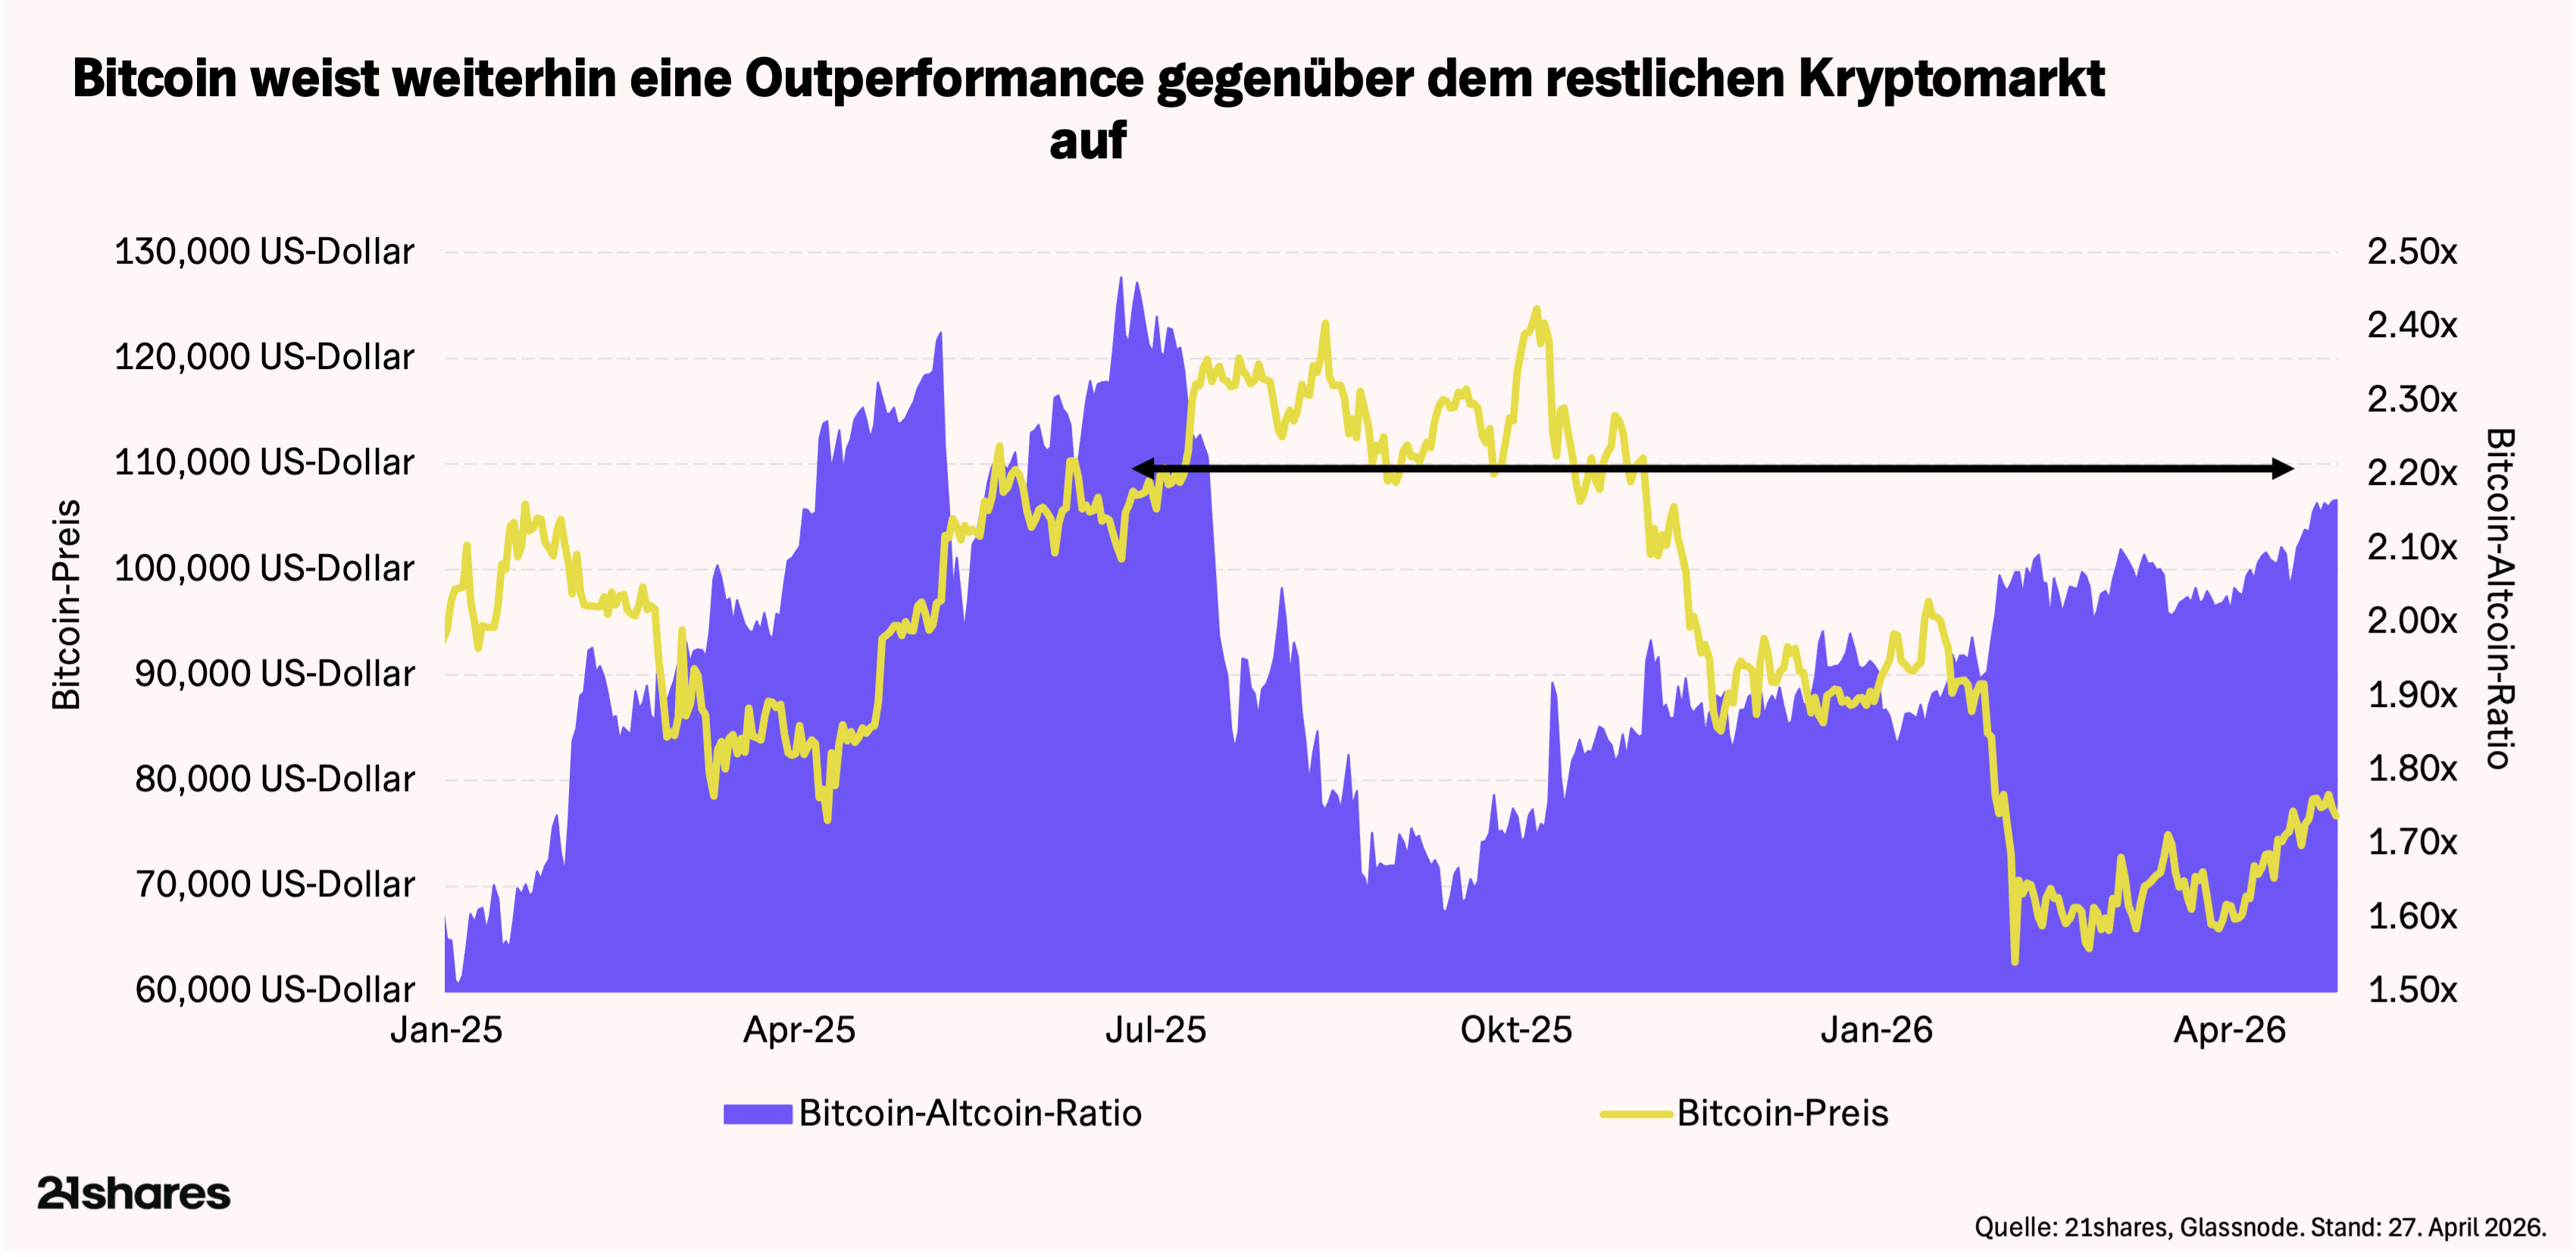
Erste Risikobereitschaft kehrt zurück, bleibt aber begrenzt
Die ersten beiden Entwicklungen erklären eine dritte. Kapital bewegt sich wieder in Richtung höheres Risiko, aber langsam und selektiv. Das Verhältnis der Marktkapitalisierung von BTC zu Altcoins stieg auf etwa 2,17 und damit auf den höchsten Stand seit Mitte 2025. Bitcoin und Ethereum, ebenfalls rund 10% im Plus im Monatsverlauf, ziehen weiterhin den Großteil der Kapitalzuflüsse an, während der breitere Altcoin Markt schwächelt. Qualität vor Breite dominiert.
Das ist ein klassisches Muster einer frühen Rotation. In früheren Zyklen bewegte sich Kapital stufenweise entlang der Risikokurve. Zuerst Bitcoin, dann Large Caps. Genau in dieser Anfangsphase befinden wir uns aktuell. Die anhaltende Unsicherheit rund um die geopolitische Lage und die strukturelle Ausrichtung institutioneller Nachfrage auf Bitcoin sorgen dafür, dass die größten und liquidesten Assets überproportional profitieren.
Ein weiterer Faktor hält Kapital konzentriert. Der Monat war schwierig für DeFi. Über 620 Millionen USD gingen durch Exploits verloren. Drift Protocol mit etwa 285 Millionen USD und Kelp mit rund 293 Millionen USD waren besonders betroffen. Auch wenn es sich um protokollspezifische Schwächen handelt, ist die Wirkung dieselbe. Große Exploits dämpfen die Risikobereitschaft onchain und begrenzen die Nachfrage nach kleineren Projekten. Die Reaktion der Branche ist ermutigend, etwa die koordinierte Initiative von DeFi United über 300 Millionen USD zur Wiederherstellung. Dennoch handelt es sich um typische Wachstumsschmerzen eines jungen Sektors. Solange die Erfolgsbilanz nicht stabiler ist, werden größere Investoren weiterhin die etablierten Assets bevorzugen.
Was sagen die technischen Daten?
Spot Analyse
- Trendstruktur: verbessert sich, ist aber noch nicht vollständig repariert. Der 50 Tage Durchschnitt bei etwa 71.600 USD liegt unter dem aktuellen Preis, und der 100 Tage Durchschnitt bei etwa 73.000 USD, der im ersten Quartal als Widerstand fungierte, wurde zurückerobert. Der 200 Tage Durchschnitt liegt weiterhin darüber bei etwa 85.000 USD. Der Abstand zwischen 50 Tage und 200 Tage Durchschnitt verringert sich, was auf eine frühe Phase einer Umkehr hindeutet. Auf längeren Zeitebenen steigen der 200 Wochen Durchschnitt bei etwa 60.200 USD und der realisierte Preis bei etwa 54.100 USD weiter an. Diese Niveaus wurden historisch nur in Phasen massiver Kapitulation unterschritten, was zeigt, dass die Zyklusstruktur intakt bleibt.
- Momentum: Der Relative Strength Index erreicht erstmals seit dem Allzeithoch wieder höhere Hochs. Zuvor bildete er niedrigere Hochs aus, bevor es zum Marktrückgang kam. Das signalisiert Kaufdruck statt der richtungslosen Bewegung im ersten Quartal. Allerdings gingen frühere Annäherungen an dieses Niveau oft mit kurzfristiger Überhitzung einher, sodass eine kurzfristige Abkühlung möglich bleibt.
- Wichtige Niveaus: Der 100 Tage Durchschnitt und die Liberation Day Zone bei etwa 74.400 USD haben sich von Widerstand zu Unterstützung gedreht. Auf der Oberseite bleibt 78.000 USD entscheidend, da hier Angebot von Investoren entsteht, die nahe am Break Even sind. Ein klarer Schlusskurs darüber öffnet den Weg in Richtung 85.000 USD. Falls die Nachfrage nachlässt, liegt die natürliche Akkumulationszone zwischen 62.000 und 70.000 USD.

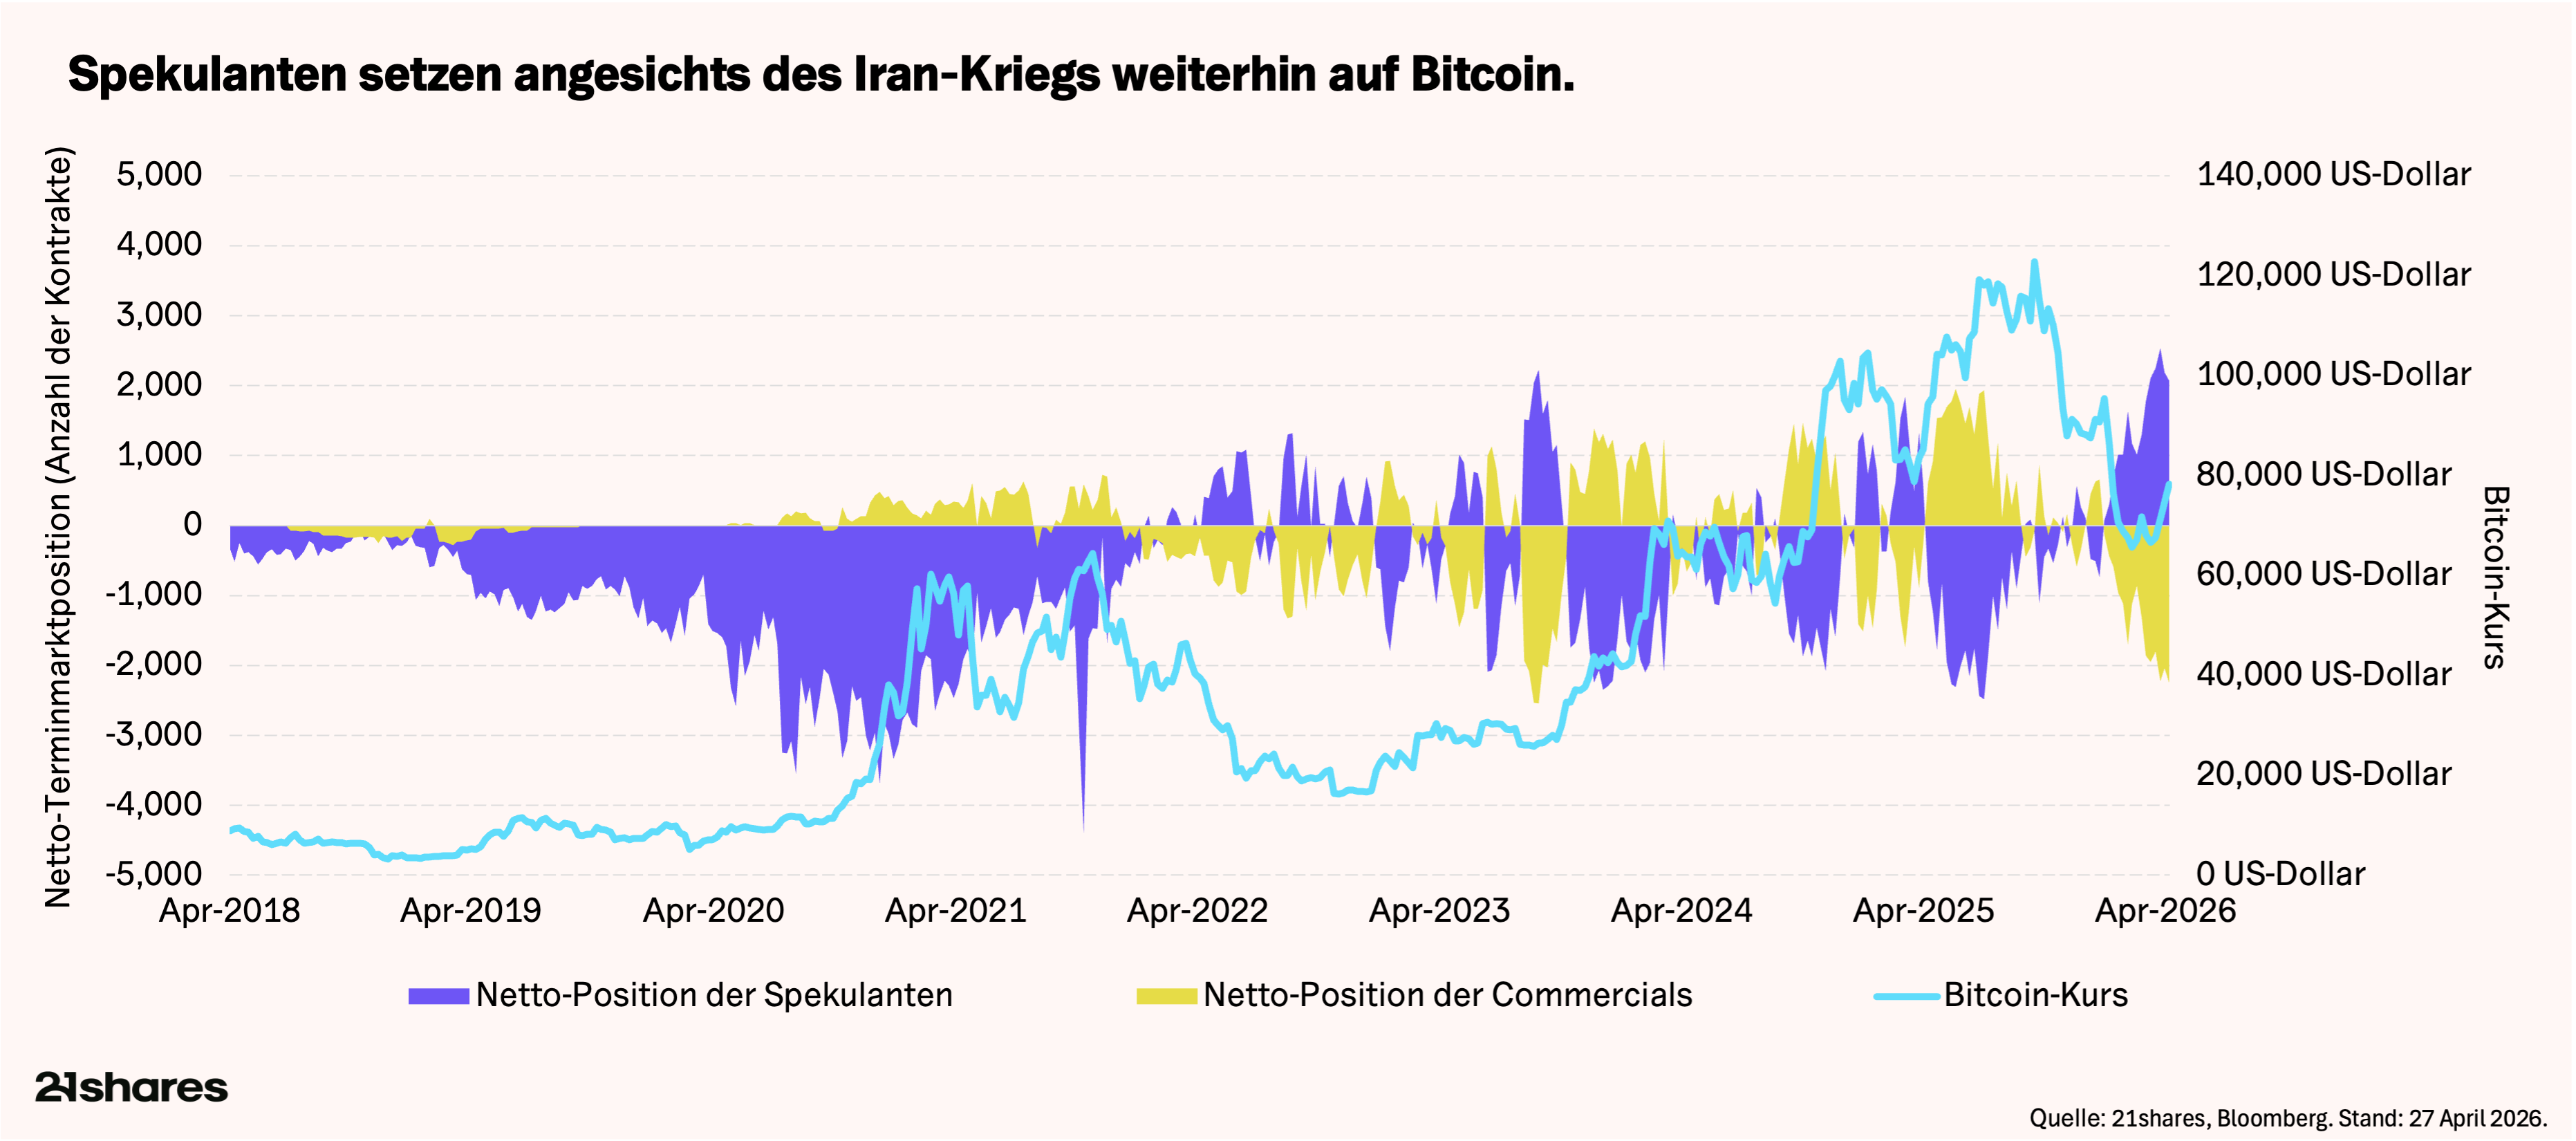
Derivate und breitere Positionierung
Die spekulative Positionierung liefert zusätzliche Hinweise. Netto Long Positionen auf CME Bitcoin Futures erreichten am 7. April ein neues Allzeithoch. Spekulanten bauten bereits im Februar und März Long Positionen auf, trotz des laufenden Konflikts, was die Überzeugung hinter der Unterstützungszone von 65.000 bis 70.000 USD unterstreicht. Gleichzeitig erzeugen solche hohen Positionierungen eigenen Gegenwind. Wenn sich der Preis dem Widerstand nähert, steigt die Wahrscheinlichkeit von Gewinnmitnahmen. Bereits etwa 20 % dieser Positionen wurden seit dem Hoch Anfang April abgebaut, was darauf hindeutet, dass spekulative Übertreibungen reduziert werden. Das ist gesund, wenn dadurch die Nachfrage aus dem Spotmarkt die Führung bei einem möglichen Ausbruch übernehmen kann.
Wichtige Fundamentaldaten und Beobachtungspunkte
Zyklusentwicklung: Rückgänge werden flacher, Geduld bleibt gefragt.
Jeder neue Zyklus zeigt geringere Drawdowns. Der aktuelle maximale Rückgang von rund 50 % seit dem Hoch im Oktober 2025 liegt deutlich unter dem historischen Durchschnitt von etwa 82 %. Das ist auf geduldiges Kapital zurückzuführen, das die Schwere von Korrekturen reduziert.
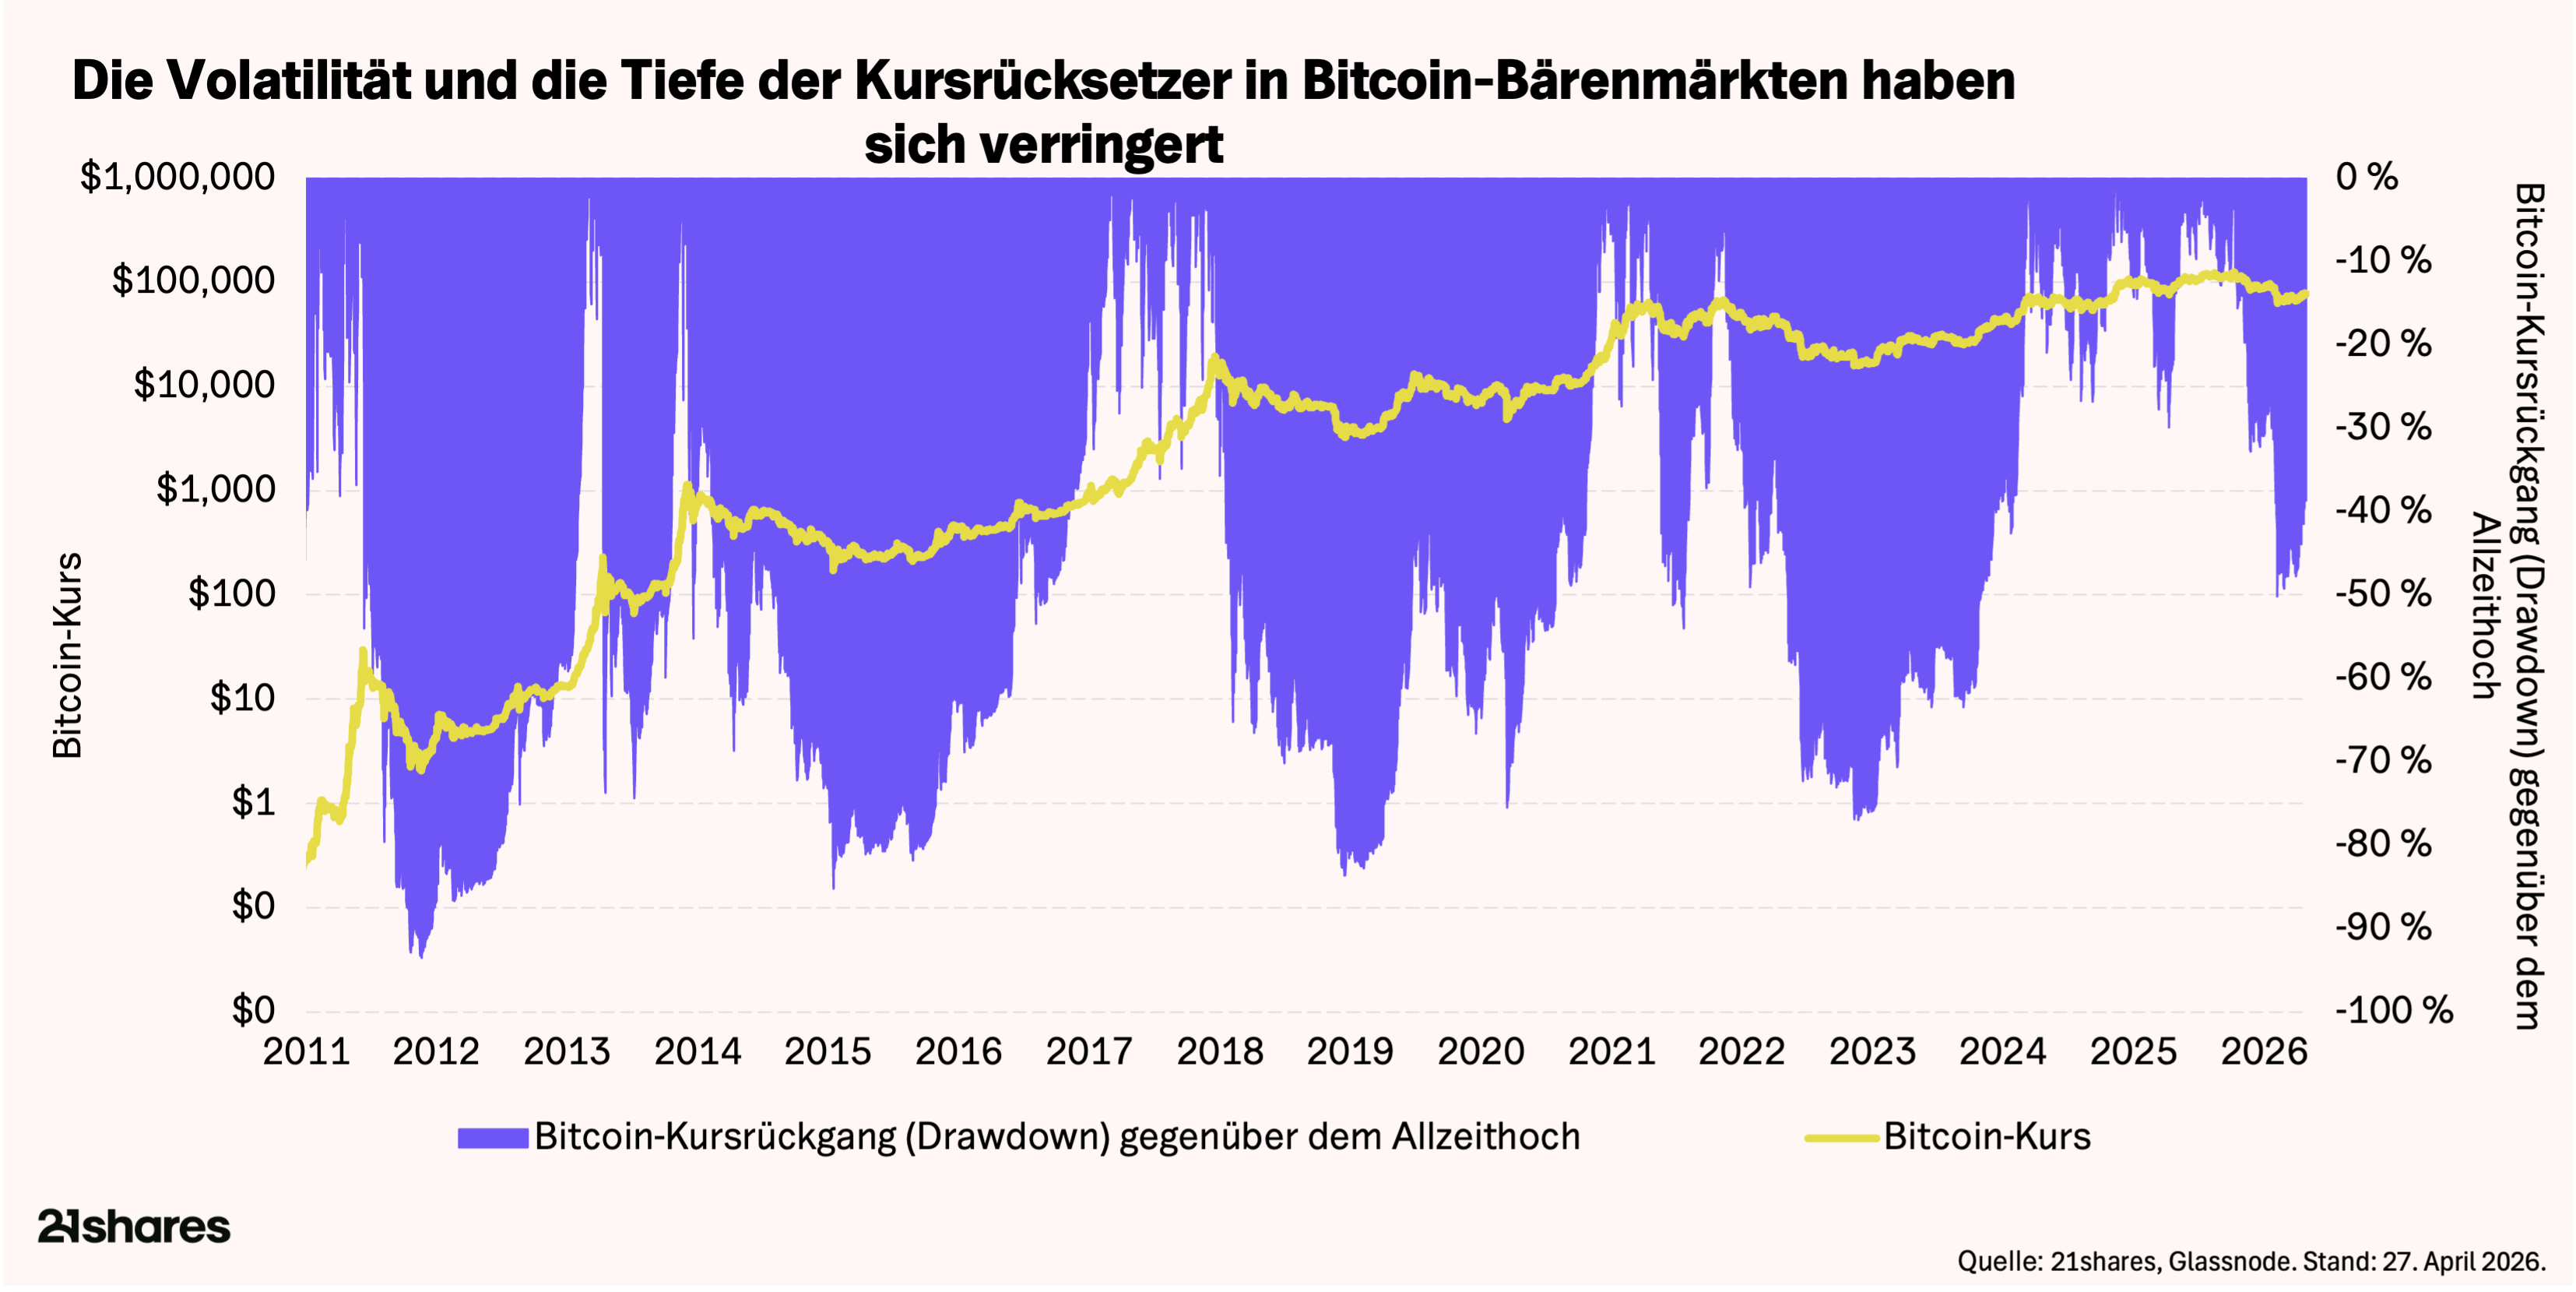
Dennoch könnte Geduld notwendig sein. Wir befinden uns etwa sechs bis sieben Monate in dieser Korrektur, während frühere Zyklen oft rund ein Jahr vom Hoch zum Tief benötigten. Ob geduldiges Kapital auch die Dauer verkürzt, bleibt offen. Viel Kapital wartet vermutlich weiterhin auf eine Bestätigung, bevor es wieder investiert wird.
Miner Situation zur Mitte des Halvings: Unter Druck, aber nicht am Limit.
Der April markierte die Mitte zwischen dem Halving im April 2024 und der nächsten erwarteten Reduktion. Das Bild ist gemischt, aber nicht alarmierend. Der Hash Ribbon Indikator signalisiert seit Ende März wieder Kapitulation, da der 30 Tage Durchschnitt der Hashrate unter den 60 Tage Durchschnitt gefallen ist. Das deutet auf steigenden Druck bei weniger effizienten Minern hin, vor allem durch höhere Energiekosten infolge der Situation in der Straße von Hormus, die über 90 % der operativen Kosten ausmachen. Die täglichen Einnahmen von etwa 33,5 Millionen USD liegen rund 24 % unter dem Jahresdurchschnitt, aber weiterhin deutlich über Niveaus, die historisch zu erzwungenen Verkäufen geführt haben.
Die Bilanzseite ist stabiler. Die Bestände der Miner sind seit Beginn von Operation Epic Fury um etwa 4.400 BTC gestiegen. Das zeigt, dass verbleibende Marktteilnehmer die aktuellen Preise im Vergleich zu zukünftigen Erwartungen als günstig einschätzen. Das größte Risiko bleibt extern. Ein weiterer Anstieg der Energiepreise würde die Margen belasten, während zunehmender Wettbewerb durch AI zusätzliche Opportunitätskosten schafft. Wahrscheinlich wird sich die Branche weiter konsolidieren, vor allem bei großen US Anbietern, die bereits über 70 % der globalen Hashrate kontrollieren. Das Basisszenario bleibt eine schrittweise Stabilisierung.
Stablecoin Angebot auf neuem Allzeithoch: Kapital bleibt im System.
Das gesamte Stablecoin Angebot hat 321 Milliarden USD überschritten und damit ein neues Allzeithoch erreicht. Seit Jahresbeginn beträgt das Wachstum etwa 10 Milliarden USD. Entscheidend ist weniger das Tempo als die Richtung, besonders im Vergleich zur letzten längeren Schwächephase. Während des Krypto Winters 2022 bis 2023 sank die Marktkapitalisierung von Stablecoins um fast 50 %, da Kapital abfloss. Dieses Mal wächst sie.
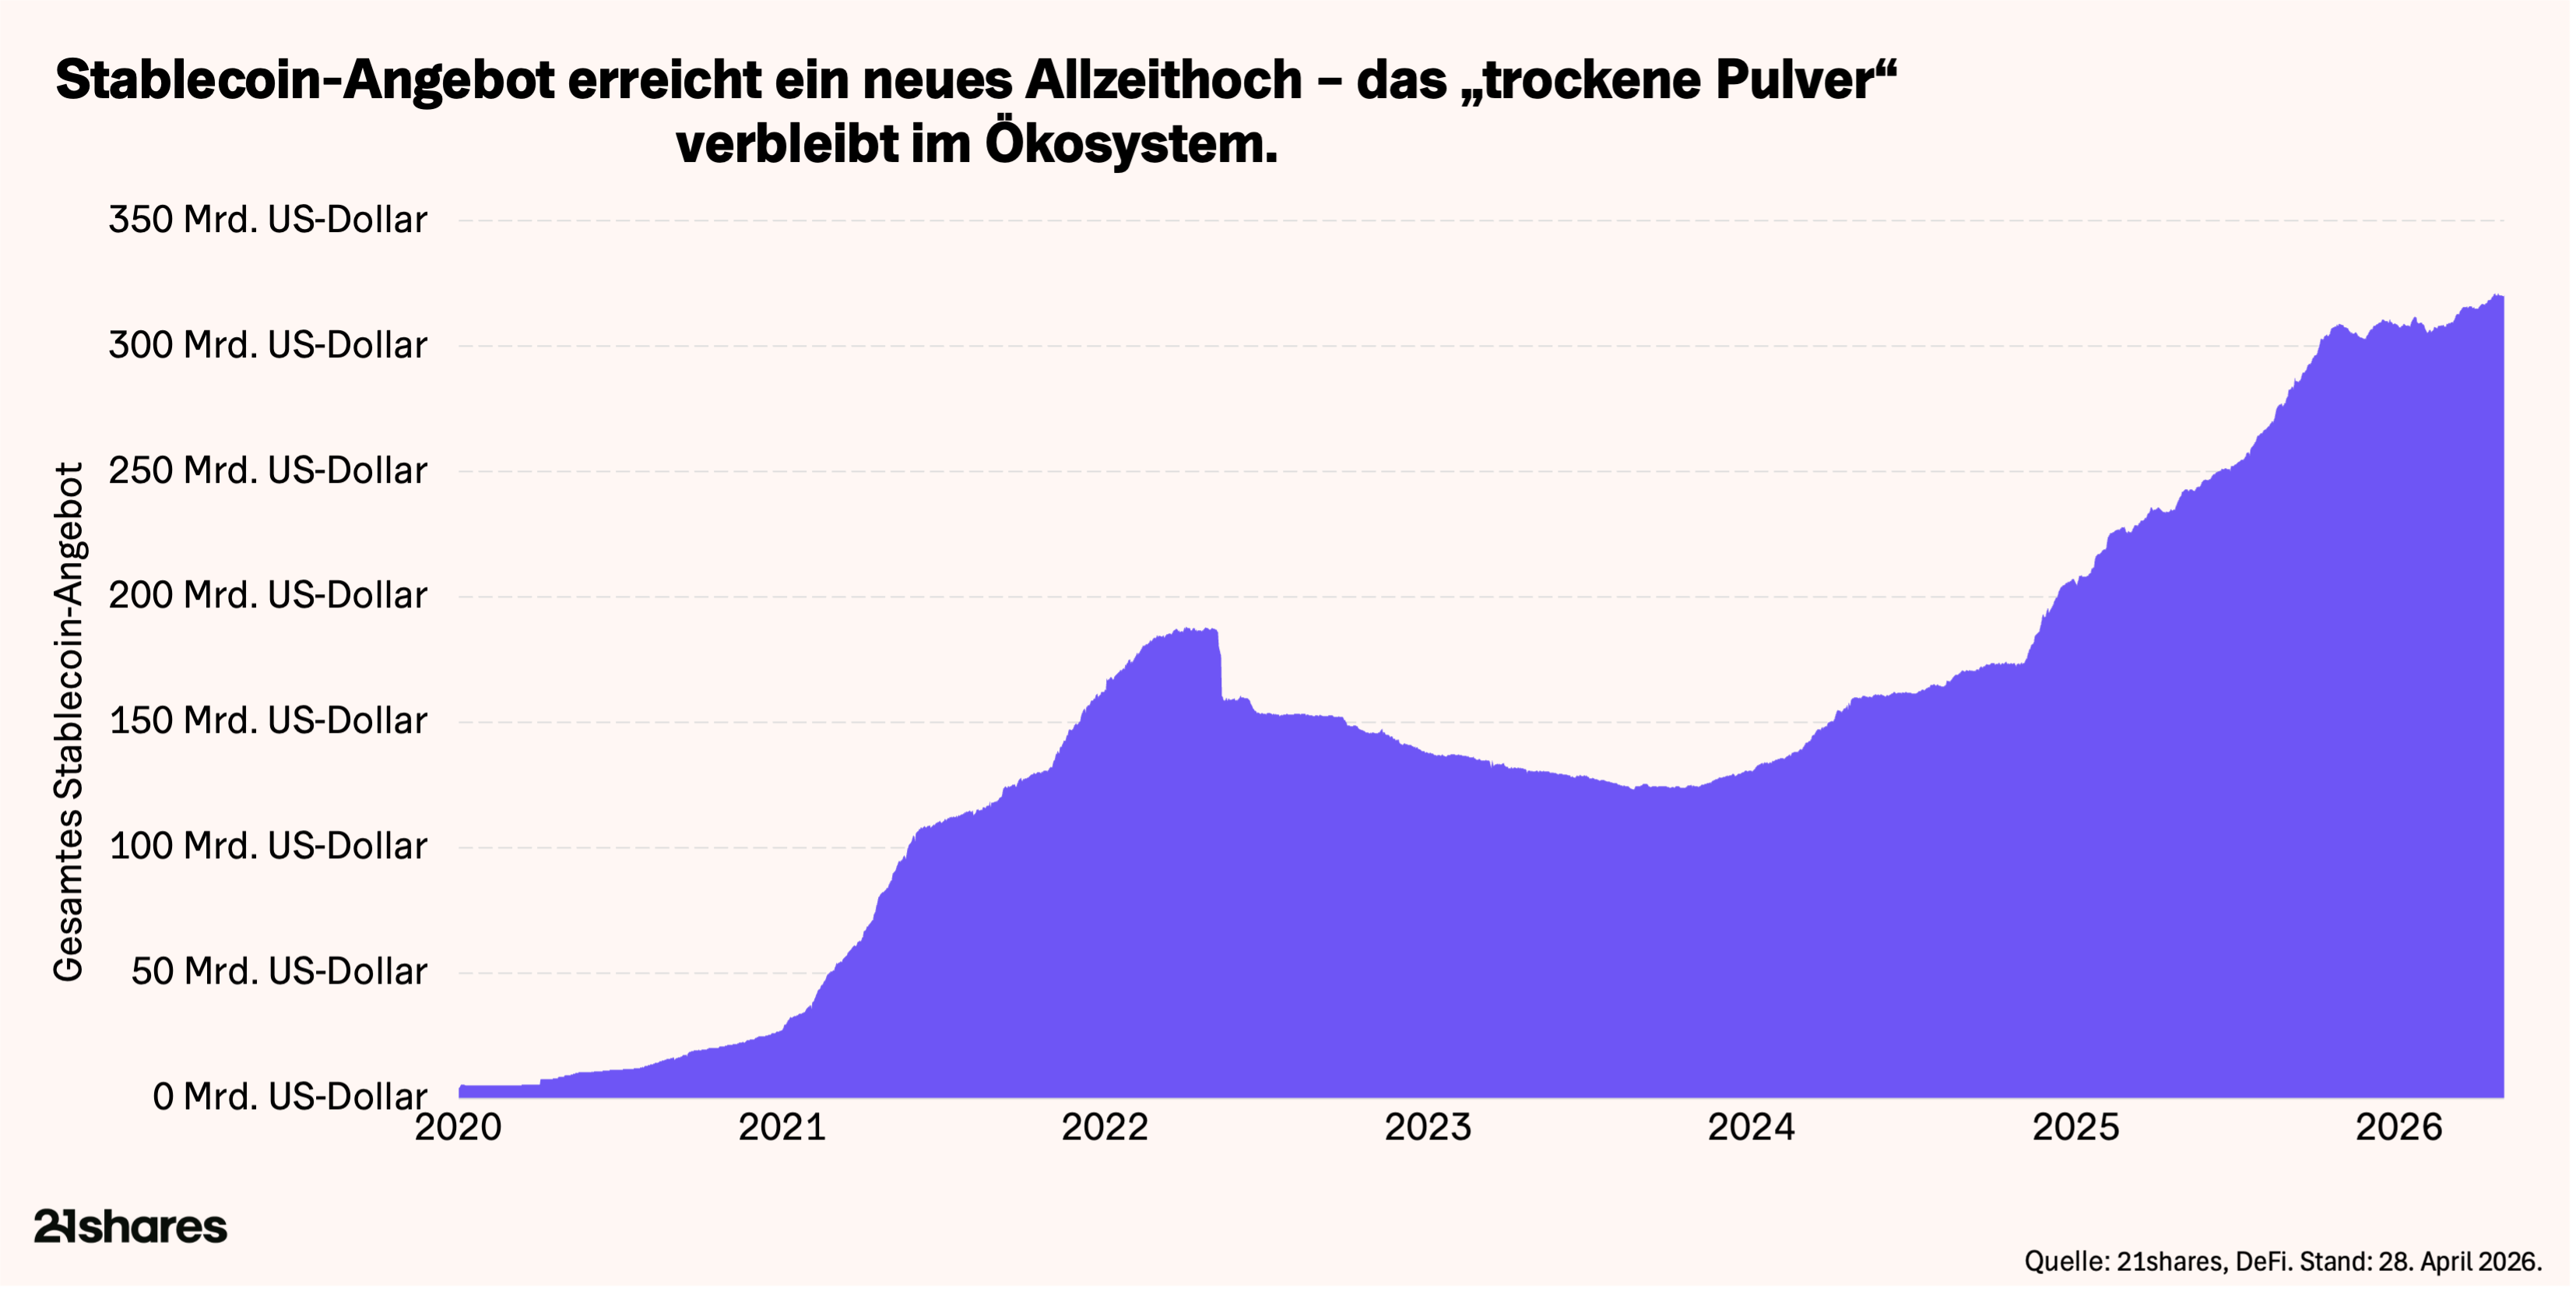
Fast die Hälfte aller Stablecoins ist eng mit der Krypto-Finanzinfrastruktur verbunden, also Börsen, DeFi und andere Plattformen. Das Wachstum zeigt daher, dass Kapital innerhalb des Systems positioniert bleibt, als Liquidität auf Börsen und in Protokollen. Genau das ist entscheidend. Anders als 2022 hat dieses Kapital den Markt nicht verlassen. Historisch war ein stabiles oder wachsendes Stablecoin Angebot während Korrekturen oft ein Vorbote für steigende Bitcoin Preise. Mit über 320 Milliarden USD, die bereitstehen, ist der Treibstoff für die nächste Bewegung bereits vorhanden.
Bullisches und bearishes Szenario
Bullisches Szenario: (Mittlere Wahrscheinlichkeit). Ein formeller Waffenstillstand oder ein Friedensabkommen mit Iran tritt ein
- Ein formeller Waffenstillstand oder ein Friedensabkommen mit Iran tritt ein und beseitigt den wichtigsten makroökonomischen Unsicherheitsfaktor. Ölpreise normalisieren sich.
- Bitcoin schließt klar über 78.000 USD auf Wochenbasis und öffnet den Weg in Richtung 85.000 USD. Eine stabile Etablierung darüber würde das Ende der Korrektur signalisieren.
- Geduldiges Kapital absorbiert weiterhin Angebot, ETF Zuflüsse bleiben stark, und das institutionelle Angebot erweitert die Käuferbasis weiter.
Bären-Szenario: anhaltende Konsolidierung oder erneuter Abwärtsversuch (geringe Wahrscheinlichkeit)
- Die Waffenstillstandsverhandlungen scheitern, und die Lage in der Meerenge spitzt sich erneut zu, wodurch der Ölpreis auf über 120 Dollar steigt und das Rezessionsrisiko wieder deutlich zunimmt. Der daraus resultierende Schock bei der Energieversorgung trübt die Erwartungen an die Politik weiter und dämpft die Risikobereitschaft.
- Die Ablehnung bei 78.000 $ hält an – das Angebot von Anlegern, deren Positionen im Minus liegen, sowie Kapital aus dem Vierjahreszyklus, das sich derzeit zurückhält, sorgen dafür, dass sich der BTC-Kurs im zweiten Quartal in einer engen Bandbreite bewegt.
- Ein Durchbrechen der 65.000-Dollar-Marke eröffnet Abwärtspotenzial in Richtung der strukturellen Untergrenze von 56.000 bis 60.000 Dollar – ein Niveau, das nur im Falle einer völligen Kapitulation durchbrochen wird.
Geduldiges Kapital wartet auf den Katalysator
Die Rally von Mitte 60.000 USD bis fast 80.000 USD wurde durch die konstruktivsten Kapitalflüsse seit dem Allzeithoch getragen. ETF Zuflüsse sind stark, Unternehmensbilanzen akkumulieren kontinuierlich. Geduldiges Kapital sieht die Korrektur als strukturellen Einstiegspunkt, nicht als Ausstiegssignal.
Der Ausbruch ist jedoch noch nicht bestätigt. Die Zone um 78.000 USD fungiert weiterhin als Widerstand. Das makroökonomische Umfeld verbessert sich zwar, ist aber noch nicht geklärt. Ölpreise bleiben hoch, Zinssenkungen wurden auf 2027 verschoben, und die wirtschaftlichen Folgen des Konflikts im Nahen Osten werden Zeit brauchen.
Die Ausgangslage ist dennoch positiv. Nachfrage baut in allen relevanten Investorengruppen eine stabile Basis auf. Was fehlt, ist ein Katalysator, der diese Akkumulation in einen nachhaltigen Ausbruch übersetzt. Der Mai könnte genau das liefern. Eine sich entwickelnde geopolitische Lage mit Potenzial zur Deeskalation, die Behandlung des CLARITY Act im Senat und der Wechsel an der Spitze der Fed am 15. Mai, wenn Warsh Powell ersetzt. Diese Faktoren werden die Zinserwartungen für den Rest des Jahres prägen. Die Grundlage wirkt zunehmend wie ein Sprungbrett und weniger wie eine Obergrenze. Ob der Mai den entscheidenden Impuls liefert, bleibt die zentrale Frage.
This report has been prepared and issued by 21Shares AG for publication globally. All information used in the publication of this report has been compiled from publicly available sources that are believed to be reliable, however we do not guarantee the accuracy or completeness of this report. Crypto asset trading involves a high degree of risk. The crypto asset market is new to many and unproven and may have the potential to not grow as expected.
Currently, there is relatively small use of crypto assets in the retail and commercial marketplace in comparison to relatively large use by speculators, thus contributing to price volatility that could adversely affect an investment in crypto assets. In order to participate in the trading of crypto assets, you should be capable of evaluating the merits and risks of the investment and be able to bear the economic risk of losing your entire investment.
Nothing in this email does or should be considered as an offer by 21Shares AG and/or its affiliates to sell or solicitation by 21Shares AG or its parent of any offer to buy bitcoin or other crypto assets or derivatives. This report is provided for information and research purposes only and should not be construed or presented as an offer or solicitation for any investment. The information provided does not constitute a prospectus or any offering and does not contain or constitute an offer to sell or solicit an offer to invest in any jurisdiction.
Readers are cautioned that any such forward-looking statements are not guarantees of future performance and involve risks and uncertainties, and that actual results may differ materially from those in the forward-looking statements as a result of various factors. The information contained herein may not be considered as economic, legal, tax, or other advice and users are cautioned against basing investment decisions or other decisions solely on the content hereof.