Die zwei Epochen der Bitcoin-Bewertung: Vor und nach den ETFs


Erkenntnisse:
- On-Chain-Kennzahlen allein reichen für die Bitcoin-Bewertung nicht mehr aus, da ein großer Teil des Handels und der Eigentumsübertragungen inzwischen Off-Chain stattfindet.
- ETFs (mit 7 % des Angebots), Terminmärkte und makroökonomische Bedingungen treiben die Preisfindung heute maßgeblich, während die Derivateaktivität stark gewachsen ist.
- Eine zeitgemäße Bitcoin-Bewertung verlangt einen kombinierten Ansatz: On-Chain-Daten müssen gemeinsam mit Off-Chain-Indikatoren wie ETF-Zuflüssen, Futures-Positionierung und makroökonomischen Liquiditätssignalen analysiert werden.
Für das erste Jahrzehnt von Bitcoins Existenz lief nahezu die gesamte Handels- und Transferaktivität direkt über die Blockchain. In dieser Phase lieferten On-Chain-Kennzahlen ein verlässliches Bild des Anlegerverhaltens und der Marktzyklen. Diese Bewertungsära endete Anfang 2024, als die Einführung von US-Spot-Bitcoin-ETFs den Markt umgestaltete. Plötzlich wurden Off-Chain-Marktdaten zu einem entscheidenden Faktor, da Investoren nun eine alternative Einstiegsmöglichkeit in den Bitcoin-Markt hatten. Zwar lösten die ETFs die Notwendigkeit einer neuen Bewertungsära aus, doch auch Terminmärkte und makroökonomische Rahmenbedingungen spielen eine Rolle. Dieser Wandel wirft eine wichtige Frage auf: Können On-Chain-Indikatoren weiterhin ein klares Bild der Marktbedingungen liefern, oder müssen sie jetzt mit Off-Chain-Daten kombiniert werden, um die Bewertung zu verstehen?
Wie die Bitcoin-Bewertung vor den ETFs funktionierte
In den ersten zehn Jahren von Bitcoins Existenz lief nahezu die gesamte ökonomische Aktivität direkt über die Blockchain. Da fast alle Transaktionen und Transfers On-Chain stattfanden, boten folgende Kennzahlen einen zuverlässigen Blick auf das Anlegerverhalten und die Marktzyklen:
- Das Market-Value-to-Realized-Value-Verhältnis (MVRV) funktionierte ähnlich wie das Kurs-Buchwert-Verhältnis in traditionellen Märkten und zeigte an, wann der Markt weit über oder unter seiner aggregierten Kostenbasis handelte.
- Messgrößen für nicht realisierte Gewinne und Verluste im Netzwerk, NUPL (Net Unrealized Profit/Loss), erfassten Phasen weit verbreiteten Optimismus oder Stress.
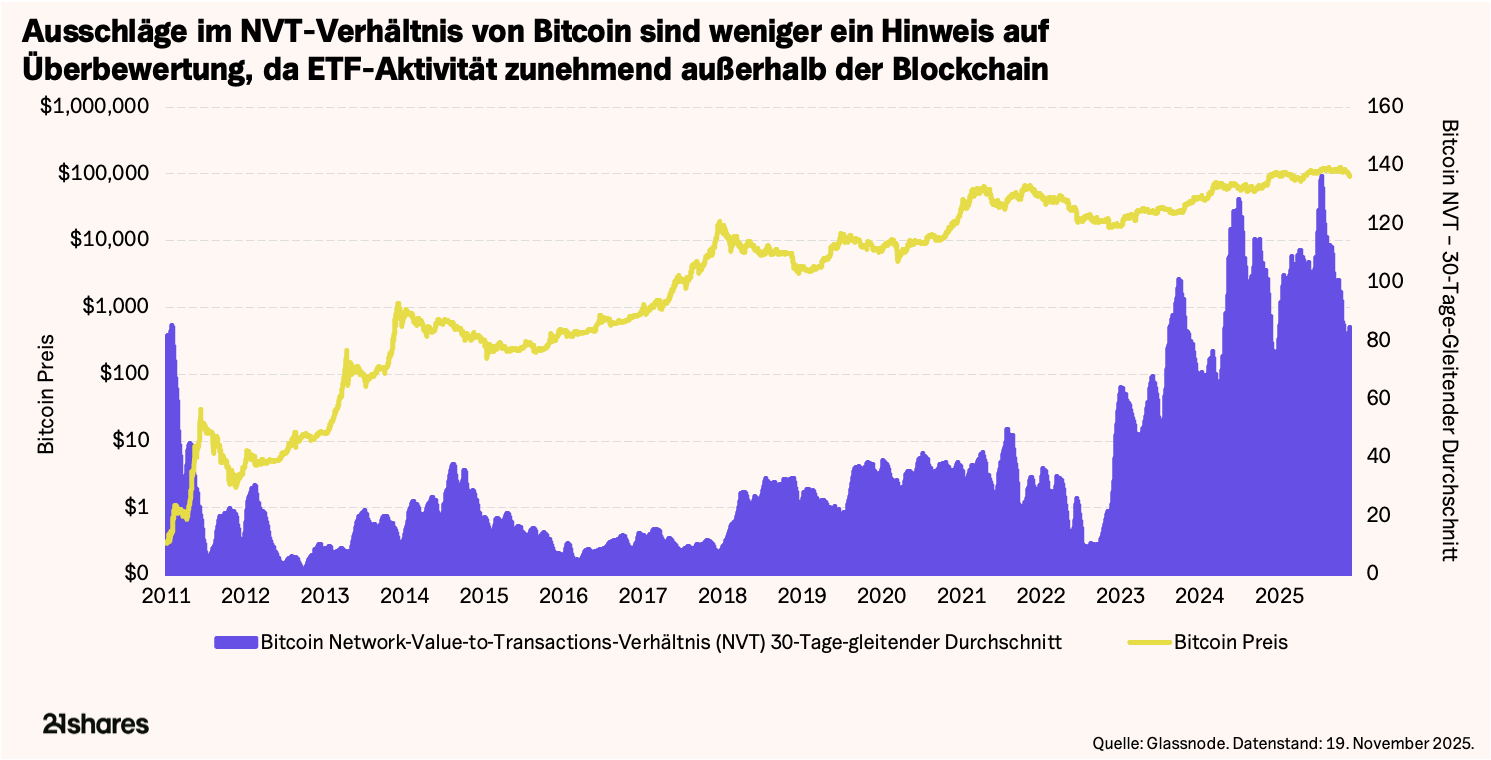
- Das Network-Value-to-Transactions-Verhältnis (NVT), vergleichbar mit einem Kurs-Gewinn-Verhältnis, setzte den Wert des Netzwerks ins Verhältnis zu den transferierten Transaktionsvolumina; NVT-Ausschläge passten gut zu zyklischen Hoch- und Tiefpunkten.
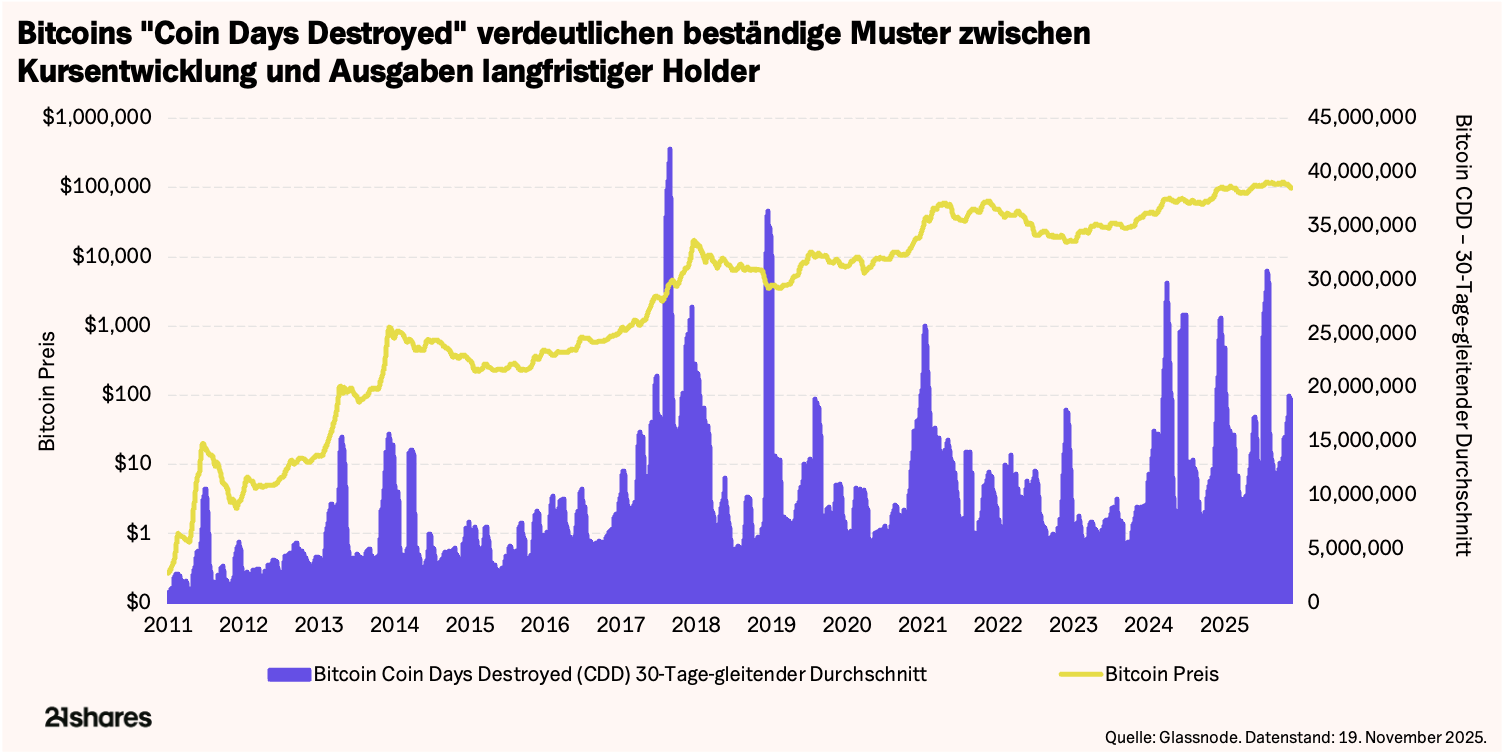
- Coin Days Destroyed (CDD), Bitcoins Pendant zur langfristigen Aktionärsrotation, zeigte, wann lange gehaltene Coins bewegt wurden.
- Breitere Aktivitätsmaße wie aktive Adressen, Transaktionszahlen und Gebühren ergänzten das Bild und stiegen typischerweise in Expansionsphasen und fielen vor Abschwüngen.
Wie ETFs den Markt verändert haben
Mit dem Start der ETFs hat sich das Bewertungsumfeld grundlegend gewandelt: Große Investoren können nun über regulierte Fonds, Terminmärkte oder Verwahrplattformen ein- und aussteigen ohne nennenswerte On-Chain-Spuren zu hinterlassen. Ein beträchtlicher Teil von Angebot und Preisfindung findet heute über Off-Chain-Instrumente statt, etwa Spot- und Futures-Fonds.
- Seit ihrem Start im Jahr 2024 haben US-Spot-Bitcoin-ETFs nahezu 1,3 Millionen Bitcoin angesammelt. Rund 7 % des Gesamtangebots und halten diese mit Custodians.
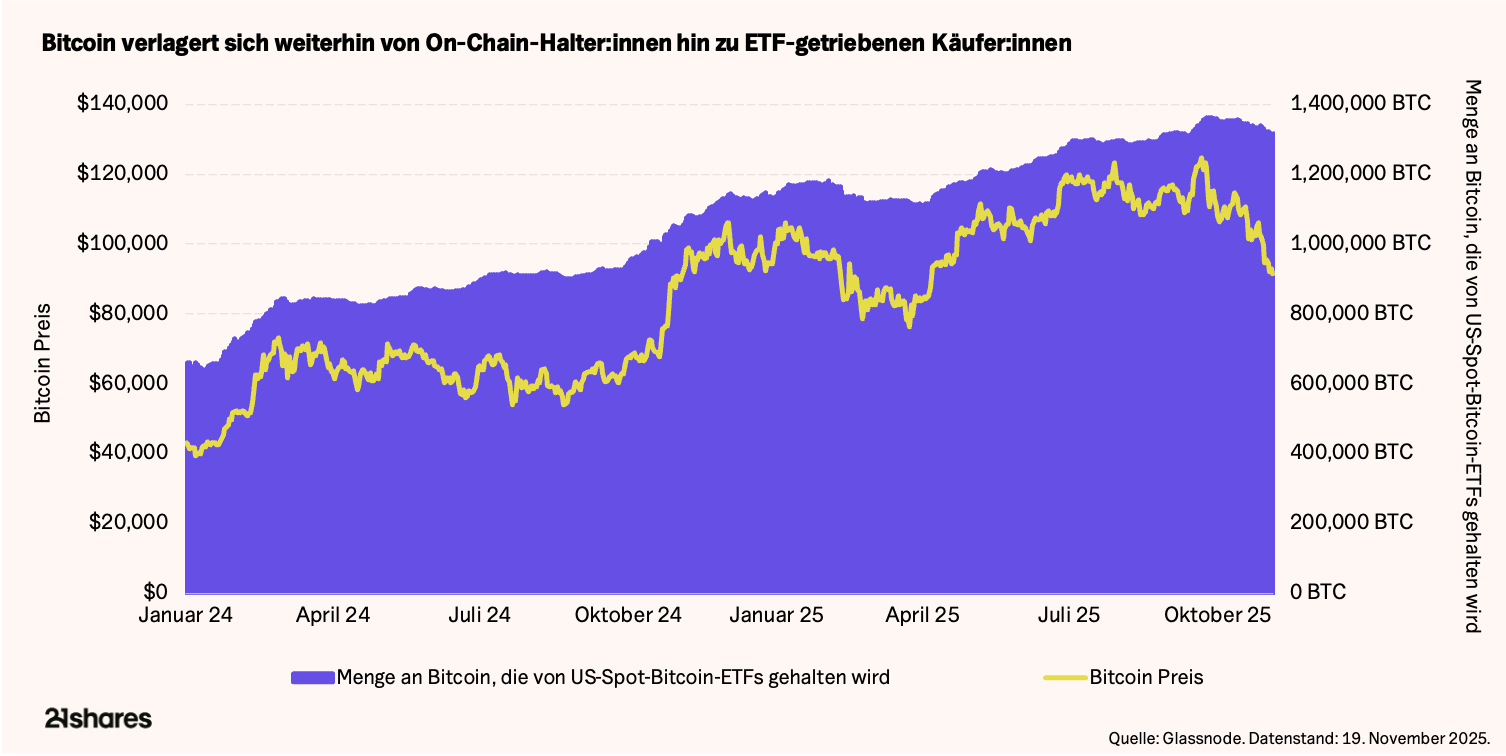
- Gleichzeitig werden Milliarden US-Dollar an Bitcoin-Exposure nun an traditionellen Börsen gehandelt, ohne dass auf der Blockchain eine entsprechende Aktivität stattfindet, weil Fondsanteile im Sekundärmarkt den Besitzer wechseln.
- Auch die Terminmärkte haben stark expandiert: Das Open Interest erreichte Anfang Oktober 20251 Rekordstände, da Marktteilnehmer große Positionen eingehen konnten, ohne Coins zu bewegen. Darüber hinaus haben makroökonomische Faktoren wie globale Liquiditätsbedingungen und Zinspolitik spürbaren Einfluss auf kurzfristige Preisbewegungen.
Diese Entwicklungen führen dazu, dass On-Chain-Daten nicht mehr die gesamte ökonomische Aktivität des Netzwerks abbilden. Grund dafür ist die zunehmende Verlagerung von Handelsvolumen in Off-Chain-ETF-Märkte, deren Umsätze kaum Spuren auf der Blockchain hinterlassen. So erreichten die aktiven Adressen im März 2025 mit 959.000 ihren Höhepunkt, als BTC bei 70.000 USD lag während das ETF-Handelsvolumen seit dem Start um über 150 % gestiegen ist, von rund 2 Milliarden USD auf über 4,5 Milliarden USD2. Die Netzwerknutzung ist entsprechend zurückgegangen: Tägliche Transaktionen fielen von fast 500.000 im Dezember 2023 auf rund 250.000, und die durchschnittlichen Transaktionsgebühren über 30 Tage sanken von etwa 265 BTC vor 2024 auf nur noch 4–7 BTC im Verlauf von 2025. Diese rückläufige On-Chain-Aktivität trat parallel zu neuen Allzeithochs von Bitcoin auf. Ein Hinweis darauf, dass einige traditionelle Metriken nicht mehr im Gleichschritt mit der Marktwertentwicklung laufen.
Wie sich traditionelle On-Chain-Kennzahlen heute verhalten
Viele der oben genannten On-Chain-Metriken, insbesondere solche, die auf Transaktionszahlen, Gebühren oder einfache NVT-Verhältnisse setzen, erfassen nicht mehr vollständig die ökonomische Aktivität. Sie bleiben hilfreich, müssen aber im Kontext einer zunehmend Off-Chain-geprägten Marktstruktur interpretiert werden. Drei Beispiele:
- Das NVT-Verhältnis ist weniger zuverlässig geworden, da große Teile der Aktivität Off-Chain stattfinden. Hohe NVT-Werte bedeuten nicht mehr zwingend Überbewertung; eine Aktualisierung der Kennzahl um ETF-Volumina und Flows könnte die Aussagekraft verbessern.
- Coin Days Destroyed (CDD), das beste Maß für langfristige Investorenaktivität, bleibt relevant. Es zeigt weiterhin an, wann lang ruhende Coins bewegt werden - oft durch frühe Investoren, die an neue Marktteilnehmer verkaufen. Ausschläge traten auch nach dem Start der ETFs rund um Marktspitzen und -tiefs auf.
- Aktivitätswerte wie aktive Adressen und Transaktionszahlen geben weiterhin Aufschluss über die Netzwerkgesundheit, korrelieren aber nicht mehr stark mit kurzfristigen Preisbewegungen.
Neue Formen von Marktdaten, die heute zählen
Eine vollständige Bewertung von Bitcoin erfordert nun die gemeinsame Betrachtung von On-Chain- und Off-Chain-Daten. Drei Off-Chain-Indikatoren sind besonders wichtig:
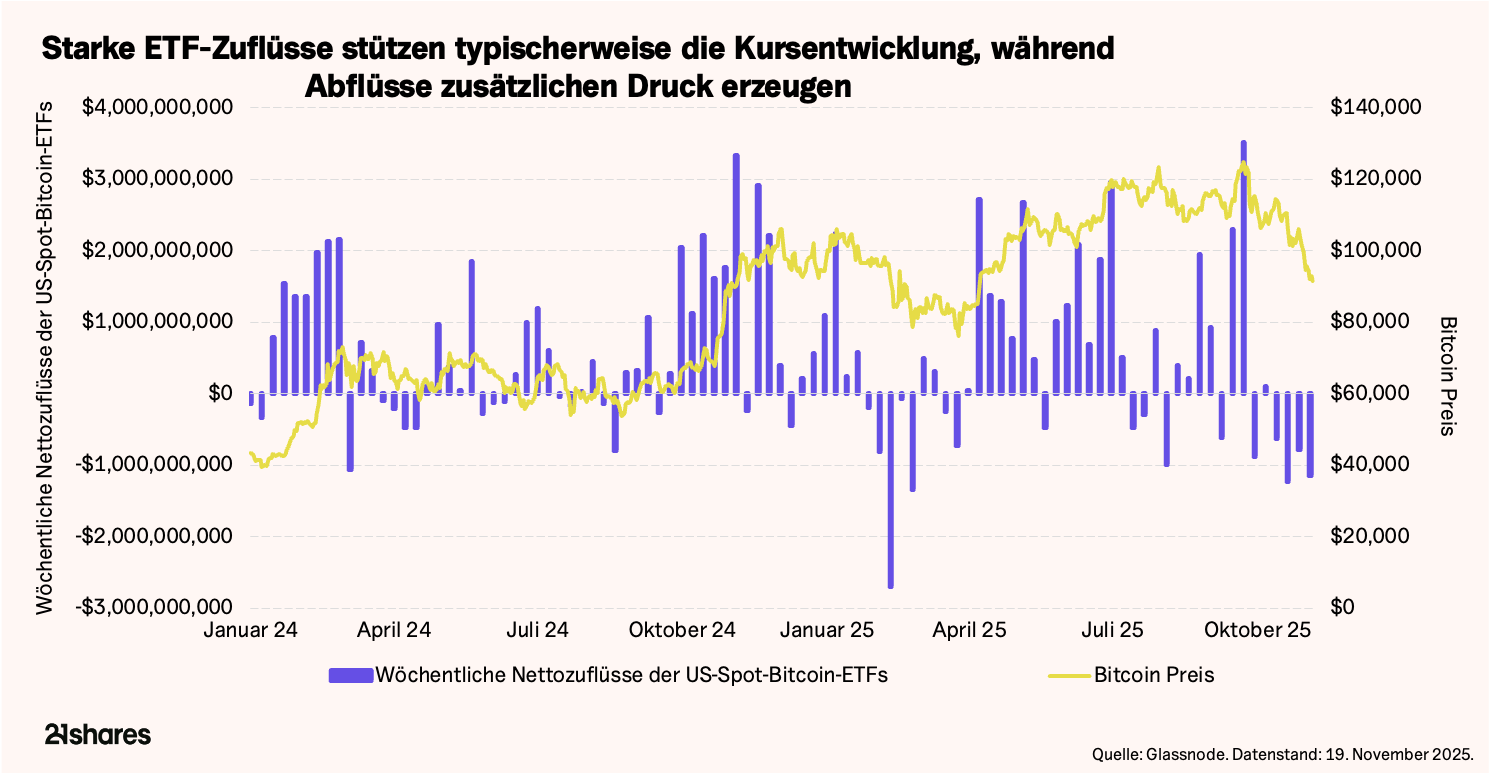
- Tägliche Inflows und Outflows liefern kurzfristige Hinweise auf die Stimmung ähnlich wie früher On-Chain-Werttransfers. Stetige Zuflüsse deuten auf starke Nachfrage hin, während große Abflüsse häufig mit Risikoaversion einhergehen.
- Daten aus den Terminmärkten bieten essentiellen Kontext: Das Open Interest ist seit Anfang 2020 um rund 500 % gewachsen und stellt heute einen wichtigen Teil der Marktstruktur dar. Steigendes Open Interest signalisiert oft bevorstehende Volatilität, während Veränderungen bei Funding Rates die Marktpositionierung abbilden. Auffällig ist, dass Open-Interest-Anstiege von 50 - 90 % in mehreren Fällen größeren Volatilitätsschüben vorausgingen (Okt 2020 - Apr 2021, Okt 2024 - Nov 2024, Apr 2025 - Okt 2025).

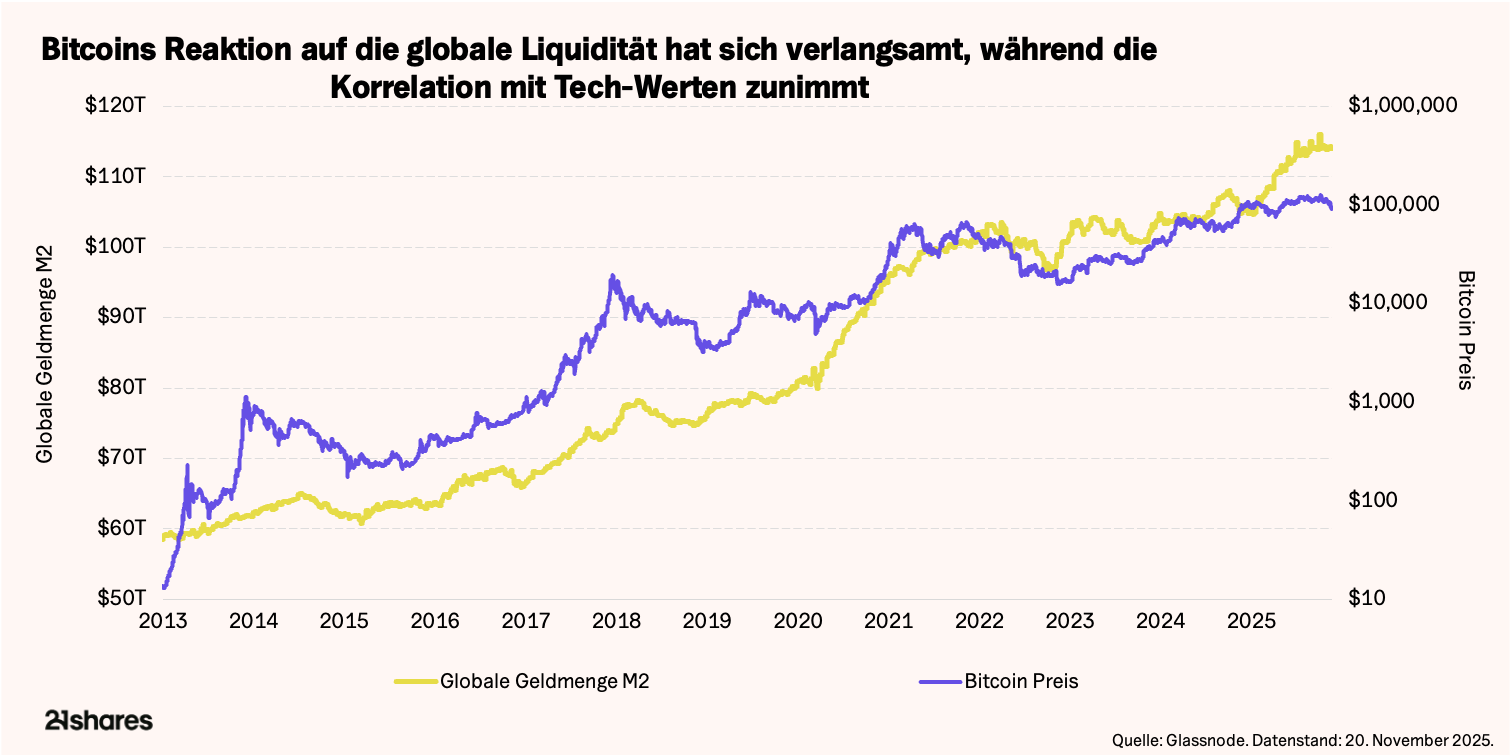
- Makroökonomische Liquidität, etwa Geldmengenwachstum und reale Zinsen, gewinnt an Bedeutung, da Bitcoin sich zunehmend wie ein globales Risikoasset verhält. Die gestiegene Korrelation mit großen Aktienindizes hat die Volatilität verstärkt und Bitcoin empfindlicher gegenüber Bewertungsänderungen in KI- und Technologiesektoren gemacht.
Wohin geht es von hier?
On-Chain-Kennzahlen bleiben wertvoll für die Analyse von Kostenbasen, Anlegerverhalten und langfristigen Zyklen doch sie liefern nicht mehr alleine das vollständige Bild. Da immer mehr Angebot in Verwahrung gehalten wird und die Preisfindung zunehmend durch ETFs und Terminmärkte erfolgt, braucht es einen integrierten Bewertungsansatz. Die Kombination aus On-Chain-Fundamentaldaten, Fondsflüssen, Derivatepositionierung und makroökonomischen Bedingungen ermöglicht heute einen klareren Blick darauf, wo Bitcoin in seinem sich weiterentwickelnden Marktzyklus steht.
______
Fußnoten:
- The Block. https://www.theblock.co/data/etfs/bitcoin-etf/bitcoin-spot-etf-volumes
- The Block. https://www.theblock.co/data/etfs/bitcoin-etf/bitcoin-spot-etf-volumes
- Glassnode. https://studio.glassnode.com/charts/addresses.ActiveCount?a=BTC and https://studio.glassnode.com/charts/fees.VolumeSum?a=BTC
- New Hedge. https://newhedge.io/bitcoin/bitcoin-correlations
This report has been prepared and issued by 21Shares AG for publication globally. All information used in the publication of this report has been compiled from publicly available sources that are believed to be reliable, however, we do not guarantee the accuracy or completeness of this report. Crypto asset trading involves a high degree of risk. The crypto asset market is new to many and unproven and may have the potential not to grow as expected.Currently, there is relatively small use of crypto assets in the retail and commercial marketplace in comparison to relatively large use by speculators, thus contributing to price volatility that could adversely affect an investment in crypto assets. In order to participate in the trading of crypto assets, you should be capable of evaluating the merits and risks of the investment and be able to bear the economic risk of losing your entire investment.Nothing herein does or should be considered as an offer to buy or sell or solicitation to buy or invest in crypto assets or derivatives. This report is provided for information and research purposes only and should not be construed or presented as an offer or solicitation for any investment. The information provided does not constitute a prospectus or any offering and does not contain or constitute an offer to sell or solicit an offer to invest in any jurisdiction. The crypto assets or derivatives and/or any services contained or referred to herein may not be suitable for you and it is recommended that you consult an independent advisor. Nothing herein constitutes investment, legal, accounting or tax advice, or a representation that any investment or strategy is suitable or appropriate to your individual circumstances or otherwise constitutes a personal recommendation. Neither 21Shares AG nor any of its affiliates accept liability for loss arising from the use of the material presented or discussed herein.Readers are cautioned that any forward-looking statements are not guarantees of future performance and involve risks and uncertainties and that actual results may differ materially from those in the forward-looking statements as a result of various factors.This report may contain or refer to material that is not directed to, or intended for distribution to or use by, any person or entity who is a citizen or resident of or located in any locality, state, country or other jurisdiction where such distribution, publication, availability or use would be contrary to law or regulation or which would subject 21Shares AG or any of its affiliates to any registration, affiliation, approval or licensing requirement within such jurisdiction.
.png)