Primer on crypto asset valuations - Q1 2025


Crypto asset valuation remains an emerging topic seeking consensus, especially as the asset class expands and matures. Robert Greer, author of "What is an asset class anyway?" argues that assets that lack an objective measure of value and have a supply constraint are more vulnerable to irrational exuberance, citing the dot-com bubble as an example. Crypto assets lack an objective measure of value today among investors, similar to emerging tech companies in the late 1990s. We propose valuation methodologies that reconcile various investors' approaches in recent years.
We can value any asset using two approaches – intrinsic or relative. Intrinsic valuation measures an asset's value based on its capacity to generate cash flows. On the other hand, relative valuation methods, also called "pricing," estimate how much to pay for an asset based on what others are paying for comparable ones.
Investors might use a discounted cash flow method (DCF) to value a stock, but they wouldn't use that for a piece of fine art. Similarly, we must outline the various types of crypto assets to understand the differences we may expect in their value accrual and specific valuation approaches. In this regard, it's helpful to categorize crypto assets according to the three asset superclasses proposed by Robert Greer:
- Capital Assets: “An ongoing source of something of value” (e.g., bonds and stocks).
- Consumable/Transformable Assets: “You can consume it. You can transform it into another asset. It has economic value, but it does not yield an ongoing stream of value” (e.g., physical commodities).
- Store of Value Assets: “They cannot be consumed, nor can they generate income. Yet they do have value” (e.g., currencies and collectibles).
Like the Internet architecture, crypto assets and blockchain technology have two layers: (1) infrastructure and (2) applications. In his 2019 work, Chris Burniske categorized crypto assets at the infrastructure layer based on the consensus mechanism of the blockchain:
- Proof-of-Work (PoW): In PoW networks like Bitcoin, the native asset (BTC) relies on a computationally and energy-intensive lottery called mining to determine which block of transactions to settle on the blockchain and reward the miners. Hence, they belong to the Consumable/Transformable asset superclass, as they essentially create “a digital-native commodity in the form of secure, globally accessible ledger space.” Investors can use the mining cost of production as a fundamental metric to gauge the lower-bound price of PoW crypto assets like BTC.
- Proof-of-Stake (PoS): In networks like Ethereum and Solana, validators must commit a portion of their capital – the “stake,” in this case, ETH – to gain access to a recurring value stream generated by the network’s rules. Hence, they fall in the Capital Asset category, and their value may be derived from the net present value of annual flows to validators using a DCF method.
While we won’t delve too deeply into the application layer, we can apply the same first-principles thinking:
- Governance tokens yield voting rights and represent ownership of the application. They are analogous to common stock in traditional finance, so they fall in the Capital Asset class.
- Utility tokens drive the economics of the system as their sole function, meaning they fall in the Consumable Asset category.
- Non-fungible tokens (NFTs) are collectibles like fine art in their most typical form today, falling in the Store of Value category.
Figure 1: Asset superclasses and their subsets
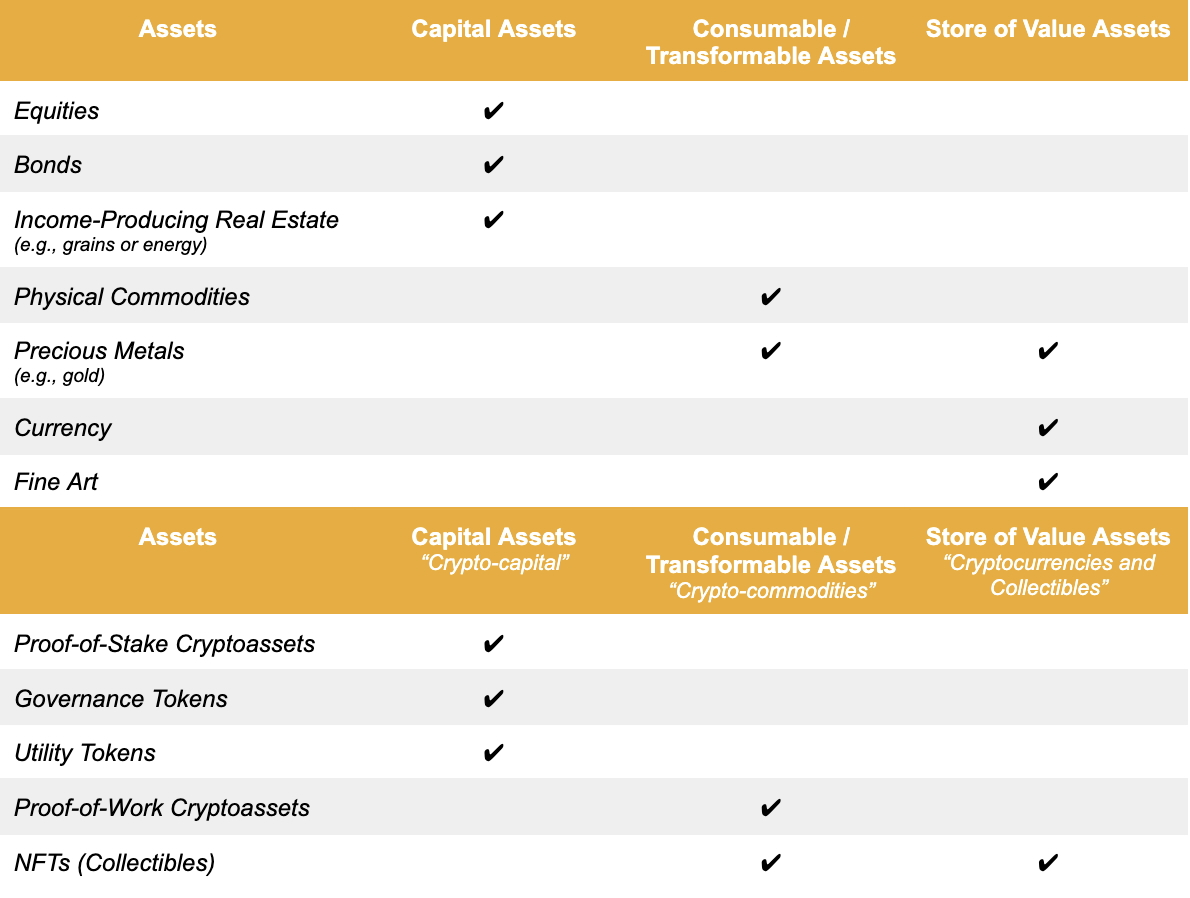
Source: 21Shares, ArkInvest
Intrinsic valuation
Ethereum
From the standpoint of a validator, PoS assets like ETH are akin to a stock paying a dividend yield, which means we can conduct a DCF valuation following four simple steps:
- Estimate the cash flows during the life of the crypto asset
- Transaction fees within the network accrue to validators. Just so, fees are a proxy for revenue. When annualized, Ethereum validators received $282.6 million in transaction fees (net after the burn mechanism) from January 1, 2025, to March 31, 2025.
- Token issuance doesn’t dilute the value of validators. On the contrary, they have the right to new issuance, similar to how shareholders may receive stock-based compensation. ETH issuance, when annualized, from January 1, 2025, to March 31, 2025, amounted to $2.586 billion.
- Total Cash Flows: a + b = ~$2.869 billion last year.
2. Estimate expected future cash flows and the lifespan of the crypto asset
- Future cash flows: We propose a slight variation of the three-stage growth model to project Ethereum’s future cash flows. Specifically, we forecast an initial period of aggressive growth, followed by an incremental decrease that eventually stabilizes at a more moderate growth rate.
- Blob Space Fees: With the implementation of EIP-4844, revenue growth from blob fees should be factored into the model and projected forward. Since inception, blob fees have accounted for less than 1% of Ethereum’s yearly fees—a figure expected to rise as more users onboard via Layer 2s (L2s) as Ethereum’s scaling solution, as illustrated by the Ethereum scaling roadmap. By making Ethereum scalable, Layer 2s will onboard millions of users on-chain, further driving demand for blob space. As more L1s like Celo transition to L2s and Web2 and TradFi companies launch their own L2s, we project blob fee growth, which we account for in the DCF.
- Lifespan of the asset: With public companies, which in theory can last forever, equity analysts generally assume that cash flows beyond a specific point in time continue in perpetuity. Investors may apply the same logic to PoS crypto assets, but for simplicity’s sake, we assume ETH’s life will be 20 years.
3. Estimate the discount rate to apply to these cash flows
- Lower-range discount rate (11.02%): Since inception, the Invesco QQQ Trust ETF obtained a 11.02% compound annual return.
- Higher-range discount rate (15.96%): Obtained using the Fama and French Three-Factor Model (market premium, size premium, and value premium).
4. Estimate the net present value (NPV) of cash flows using the above parameters
Assuming a discount rate of 11.02%, the implied price per one ETH today would be around $7,249, a 297% increase from ETH’s price ($1,824) as of March 31, 2025. On the other hand, if we use a 15.96% discount rate, the implied price per one ETH would be $3,998, still a substantial increase of 119% from ETH’s current price. Investors should interpret the results of this DCF valuation with caution and run their own assumptions regarding projected cash flows and discount rates. The rationale behind our approach was to be conservative and capture the high volatility of ETH in the discount rate to reflect the asset’s riskiness accurately. Another implicit assumption of this approach is that the asset’s monetary premium is embedded in the DCF.
Figure 2: ETH DCF Valuation
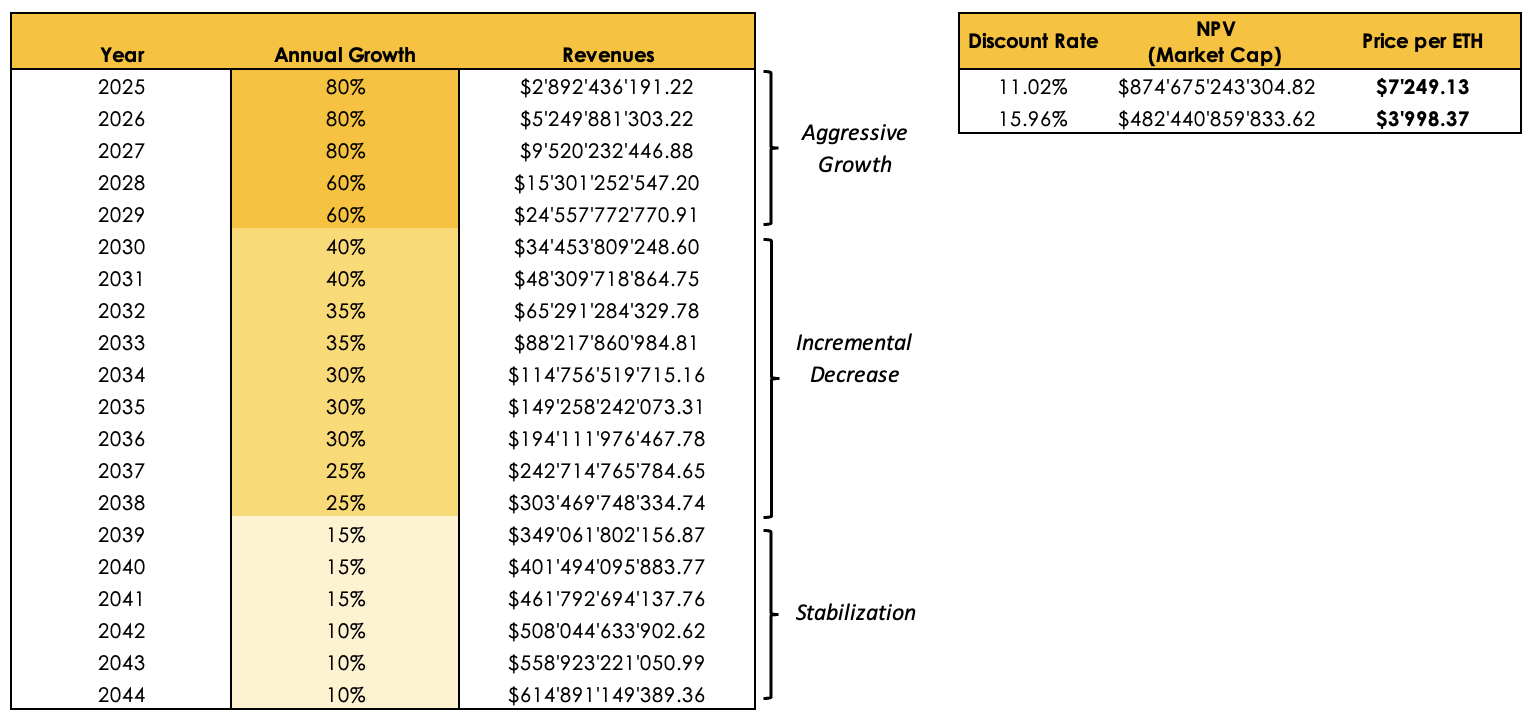
Source: 21Shares. Data as of March 31, 2025
Solana
Solana operates under a hybrid consensus mechanism that combines its pioneering Proof of History (PoH) protocol with a traditional Proof of Stake (PoS) system. Given the role of validators in securing the network and earning staking rewards and transaction fees, a DCF valuation approach similar to that used for Ethereum can be applied to Solana. In this framework, we view Solana as a productive asset where validators generate cash flows through transaction fee revenue, staking rewards, and token issuance.
One important distinction, however, is that on the Solana network, only 50% of transaction fees are burned, while the remaining 50% accrue to validators. This differs from Ethereum, where 100% of transaction fees (post-EIP-1559) are burned. As a result, the structure of cash flows to validators on Solana is fundamentally different, which we account for in our valuation model. The DCF calculation steps for Solana are essentially the same as those outlined for Ethereum and are as follows:
1. Estimate the cash flows during the life of the crypto asset
- Transaction fees within the network accrue to validators. Just so, fees are a proxy for revenue. On the Solana network, transaction fees represent a larger share of total validator revenue compared to Ethereum, accounting for approximately 21% vs ETH’s ~9% of total revenue in Q1 2025. This higher contribution is driven by the greater prevalence of tipping on Solana, where users pay additional fees to prioritize their transactions. When annualized, Solana validators received $984.86 million in transaction fees (net after the burn mechanism; however, it should be noted that the burn mechanism is no longer in effect as of Feburary of this year) from January 1, 2025, to March 31, 2025.
- Token issuance doesn’t dilute the value of validators. On the contrary, they have the right to new issuance, similar to how shareholders may receive stock-based compensation. SOL issuance, when annualized, from January 1, 2025, to March 31, 2025, amounted to $2.420 billion.
- Total Cash Flows: a + b = ~$3.405 billion last year.
2. Estimate expected future cash flows and the lifespan of the crypto asset
- Future cash flows: We propose a slight variation of the three-stage growth model to project Ethereum’s future cash flows. Specifically, we forecast an initial period of aggressive growth, followed by an incremental decrease that eventually stabilizes at a more moderate growth rate.
- Lifespan of the asset: With public companies, which in theory can last forever, equity analysts generally assume that cash flows beyond a specific point in time continue in perpetuity. Investors may apply the same logic to PoS crypto assets, but for simplicity’s sake, we assume ETH’s life will be 20 years.
3. Estimate the discount rate to apply to these cash flows
- Lower-range discount rate (11.02%): Since inception, the Invesco QQQ Trust ETF obtained a 11.02% compound annual return.
- Mid-range discount rate (19.87%): Obtained using the Fama and French Three-Factor Model (market premium, size premium, and value premium).
- Higher-range discount rate (33.05%): Obtained using the Fama and French Three-Factor Model, with Bitcoin serving as the market premium. (market premium, size premium, and value premium).
4. Estimate the net present value (NPV) of cash flows using the above parameters
Assuming a discount rate of 11.02%, the implied price per one ETH today would be around $1796, a 1339% increase from SOL’s price ($125) as of March 31, 2025. If we use the mid-range discount rate of 19.87%, we arrive at a price of $646.65 - a return of over 418%. On the other hand, if we use the higher range of a discount rate of 33.05%, the implied price per one SOL would be $198.30, still a substantial increase of 59% from SOL’s current price. Investors should interpret the results of this DCF valuation with caution and run their own assumptions regarding projected cash flows and discount rates. The rationale behind our approach was to be conservative and capture the high volatility of ETH in the discount rate to reflect the asset’s riskiness accurately. Another implicit assumption of this approach is that the asset’s monetary premium is embedded in the DCF.
Figure 3: SOL DCF Valuation

Source: 21Shares. Data as of March 31, 2025
Bitcoin
Regarding crypto-commodities, the marginal cost of production is vital as it sets the price floor at which producers (miners) are willing to sell. From the outset, it is crucial to emphasize that we are not suggesting that the price of BTC should be determined by its marginal cost of production. To do so would be to adopt a labor theory of value, which is ostensibly false. Instead, the marginal cost of production is a tool that can help investors estimate a lower bound price level for BTC and other crypto-commodities.
In 2019, Charles Edwards proposed a methodology to estimate the global average US dollar cost of producing one BTC. The first component of the method is the Cambridge Bitcoin Electricity Consumption Index (CBECI), which provides an up-to-date estimate of the Bitcoin network’s daily electricity load. Edwards estimates the cost of production per BTC by:
- Calculating the number of BTC Mined Per Day (based on miner rewards)
- Calculating the daily electricity cost to mine one BTC (Daily Electrical Cost)
- Estimating the global average “Elec-to-Total Cost Ratio” = (Bitcoin Electrical Cost) / (Daily Cost of running a Bitcoin Mining Business)
An investor can then compute Bitcoin Production Cost as (Daily Electrical Cost) / (Elec-to-Total Cost Ratio). Finally, the Bitcoin Production Cost is compared to the “Bitcoin Miner Price,” which attempts to capture the revenue one BTC provides to miners. Bitcoin Miner Price is calculated as follows: BTC Price + (Daily Transaction Fees) / (Daily BTC mined). When the BTC price is below the total cost of mining one BTC, it signals that Bitcoin miners may be struggling and potentially taking short-term losses.
Figure 4: Bitcoin Mining Cost of Production

Source: 21Shares. Data as of March 31, 2025
As of March 31, 2025, the estimated global average electricity cost to mine one BTC is $58,779, while the estimated global average total cost to mine one BTC is $97.964. To reiterate, investors shouldn’t interpret this range as the fundamental value of Bitcoin, which is subjective, but rather as an estimate of its price floor based on miner profitability and subsequent behavior patterns.
Relative valuation
A significant portion of equity valuations in traditional finance consists of relative valuations based upon market sizing and multiples. This approach helps determine whether a given asset is undervalued or overvalued relative to its peers and is more likely to reflect market perceptions and sentiment than a fundamental valuation. Moreover, investors can use relative valuations to "price" any asset, not just ones that generate cash flows.
Bitcoin
Investors cannot value store-of-value assets intrinsically because their value is primarily determined by the subjective beliefs of many individuals. Thus, we can utilize a simple market sizing approach to estimate a target price. The methodology involves establishing a Total Addressable Market (TAM) and a percent share the asset in question could take - Market Penetration. For instance, an investor could price Bitcoin by setting a proportion it could capture of the market value of gold, the seminal store-of-value asset.
As of March 31, 2025, the price of BTC is $82,358, with an implied circulating market cap of approximately $1.634 trillion. On the other hand, the market cap of gold sits at around $21.805 trillion. Thus, we can use the market sizing methodology described above to estimate the hypothetical price of BTC if it were to capture a given percent share of gold’s market cap. For instance, Figure 4 shows that if BTC were to capture 25% of gold’s market cap, it would be priced at $274,758. In the most optimistic scenario contemplated, if BTC penetrates 100% of gold’s market cap, the price of one BTC would be roughly $1.1 million.
As of March 31, 2025, the price of BTC is $82,358, with an implied circulating market cap of approximately $1.634 trillion. On the other hand, the market cap of gold sits at around $21.805 trillion. Thus, we can use the market sizing methodology described above to estimate the hypothetical price of BTC if it were to capture a given percent share of gold’s market cap. For instance, Figure 4 shows that if BTC were to capture 15% of gold’s market cap - a level we could easily see Bitcoin reaching by the end of 2025 - it would be priced at approximately $165,000. Looking further ahead, by the next halving in 2028, it’s plausible that Bitcoin could capture 25% of gold’s market cap, which would put the price of one BTC at roughly $274,758. Over an even longer time horizon, potentially over the next decade and beyond, Bitcoin reaching full parity with gold’s market cap could imply a price of approximately $1.1 million per BTC.
Figure 5: Projected BTC Price at Various % of Gold's Market Cap

Source: 21Shares, Data as of March 31, 2025.
Solana
Investors often cannot value smart contract platforms like Solana purely through intrinsic methods, as much of their value is determined by relative adoption, network effects, and competitive positioning. As a result, a simple relative valuation approach can be used to estimate a target price. This methodology involves identifying a comparable TAM—in this case, Ethereum—and assessing the share Solana could capture relative to it. Ethereum serves as Solana’s closest pure-play competitor, making it the most logical benchmark for a relative valuation. For example, an investor could price Solana by estimating the proportion of Ethereum’s market capitalization that Solana could reasonably attain over time.
As of March 31, 2025, Solana’s market capitalization stands at approximately $63.77 billion, representing about 29.3% of Ethereum’s market capitalization of $217.78 billion. Solana’s current price is $124.87. This relative positioning provides a foundation for a comparative valuation framework, where Solana’s potential upside can be estimated based on different levels of market share relative to Ethereum.
If Solana were to reach 50% of Ethereum’s market capitalization, its implied price would be approximately $213.23. At 75% coverage, the implied price would increase to around $319.84—a level that appears highly achievable given that Solana traded near $300 earlier this year. Full parity with Ethereum’s market capitalization would imply a price of roughly $426.45. These relative valuation scenarios offer investors a framework for assessing Solana’s potential upside as it continues to expand its role in the smart contract platform ecosystem.
It should be noted, however, that Ethereum has recently lagged Solana in price performance, and as a result, these relative valuation ratios are likely to shift over time depending on how price acceleration evolves for each respective asset.
Figure 6: Projected SOL Price at Various % of ETH’s Market Cap

Source: 21Shares, Data as of March 31, 2025.
Challenges to Crypto asset Valuations
There are various challenges and shortcomings regarding crypto asset valuations, such as insufficient historical data and complexities unique to the asset class. Valuation models are adapted from traditional finance and may not fully capture the distinct features of crypto assets, leading to potential inaccuracies particularly in the context of a rapidly changing industry.
For instance, the cash flows that PoS networks generate are not paid in fiat currency but rather in the native tokens of the network. This situation is as if Apple charged its customers in Apple shares instead of U.S. dollars. This unique feature creates a reflexivity problem because the dollar-denominated value of the revenue stream is directly dependent on the crypto asset's value.
We have provided investors with actionable methods to value crypto assets. The complexity and uncertainty of valuing this asset class might intimidate investors. However, it is worth remembering that the more uncomfortable an investor feels when valuing an asset, the greater the payoff of doing the valuation. Investors are encouraged to use these frameworks as starting points but should run their own models with tailored assumptions to arrive at valuations that align with their individual objectives, and risk tolerance.
This report has been prepared and issued by 21Shares AG for publication globally. All information used in the publication of this report has been compiled from publicly available sources that are believed to be reliable, however, we do not guarantee the accuracy or completeness of this report. Crypto asset trading involves a high degree of risk. The crypto asset market is new to many and unproven and may have the potential not to grow as expected.
Currently, there is relatively small use of crypto assets in the retail and commercial marketplace in comparison to relatively large use by speculators, thus contributing to price volatility that could adversely affect an investment in crypto assets. In order to participate in the trading of crypto assets, you should be capable of evaluating the merits and risks of the investment and be able to bear the economic risk of losing your entire investment.
Nothing herein does or should be considered as an offer to buy or sell or solicitation to buy or invest in crypto assets or derivatives. This report is provided for information and research purposes only and should not be construed or presented as an offer or solicitation for any investment. The information provided does not constitute a prospectus or any offering and does not contain or constitute an offer to sell or solicit an offer to invest in any jurisdiction. The crypto assets or derivatives and/or any services contained or referred to herein may not be suitable for you and it is recommended that you consult an independent advisor. Nothing herein constitutes investment, legal, accounting or tax advice, or a representation that any investment or strategy is suitable or appropriate to your individual circumstances or otherwise constitutes a personal recommendation. Neither 21Shares AG nor any of its affiliates accept liability for loss arising from the use of the material presented or discussed herein.
Readers are cautioned that any forward-looking statements are not guarantees of future performance and involve risks and uncertainties and that actual results may differ materially from those in the forward-looking statements as a result of various factors.
This report may contain or refer to material that is not directed to, or intended for distribution to or use by, any person or entity who is a citizen or resident of or located in any locality, state, country or other jurisdiction where such distribution, publication, availability or use would be contrary to law or regulation or which would subject 21Shares AG or any of its affiliates to any registration, affiliation, approval or licensing requirement within such jurisdiction.