

Key takeaways:
- August delivered the catalyst. The Treasury's buyback escalation drove bitcoin up ~25%, its best month since November 2024, arriving squarely in the historical window where prior bear markets have ended.
- The rally has legs. A record short liquidation lit the move, but open interest sits at half its October 2025 peak, funding is uncrowded, and $3.05 billion in ETF inflows confirm real spot demand underneath.
- September decides. Watch $76,000–$78,000 support, ETF flow continuity, and long-end yields. The $81,000–$82,000 level separates trend recovery from bear-market bounce. Treat weakness as a late-cycle retest to buy, not a reason to step away.
August was the month the market stopped debating the bottom and started trading the turn. The US Treasury's decision to at least double its long-end bond buybacks, read by markets as quiet easing and a green light for the debasement trade, sent bitcoin up close to 12% in 24 hours and roughly 25% on the month so far, its best month since November 2024 and its best August since 2017. Just as important as the size of the move is its timing: it arrived with the cycle clock deep inside the window where past bear markets have ended, and with the bottom signals we flagged in our bitcoin cycle bottom indicators already flashing.
In this report, we’ll identify what has to hold, what has to follow through, and what would tell us this was the formal turn away from the bear, rather than one last positioning squeeze.
Three forces drove bitcoin's 25% August rally
1) Liquidity did the heavy lifting
The maximum size of each Treasury liquidity-support operation in the 10-to-30-year sectors rises to at least $4 billion. The initial reaction was textbook: the 30-year yield, which had touched a 19-year high a day earlier, fell 10 basis points, the dollar weakened, and gold and bitcoin rallied together. Both moved in the same direction, a clean expression of the debasement trade. But the bond market's truce barely lasted a session: long-end yields rebounded, erasing the announcement's relief within a day and forcing the Treasury to escalate. Bessent first signalled operations could run beyond $4 billion, then went further still, floating the roughly $1 trillion sitting in the Treasury General Account as a far larger buyback channel. That sequence is the tell that investors doubt the government's grip on its own borrowing costs, and it is why this episode may mark the start of a new regime rather than a one-off. With interest costs running above 20% of federal tax revenue (Congressional Budget Office, 2026 Baseline Projections), this is the fiscal dominance and scarce assets dynamic in play: pressure falls on cash and bonds. Bitcoin, gold, and silver have historically benefited in this environment.
2) Washington added to crypto's fuel
In a single week, the Securities and Exchange Commission (SEC) proposed "Regulation Crypto Assets" (token offerings of up to $75 million a year without full registration), President Trump hosted crypto executives alongside the SEC and Commodity Futures Trading Commission (CFTC) chairs, pressed the Senate to pass the CLARITY Act ahead of its 15 September vote, and said the CFTC is working to bring Hyperliquid into US regulatory frameworks in a fully compliant and legal fashion.
3) Market positioning and flows amplified it
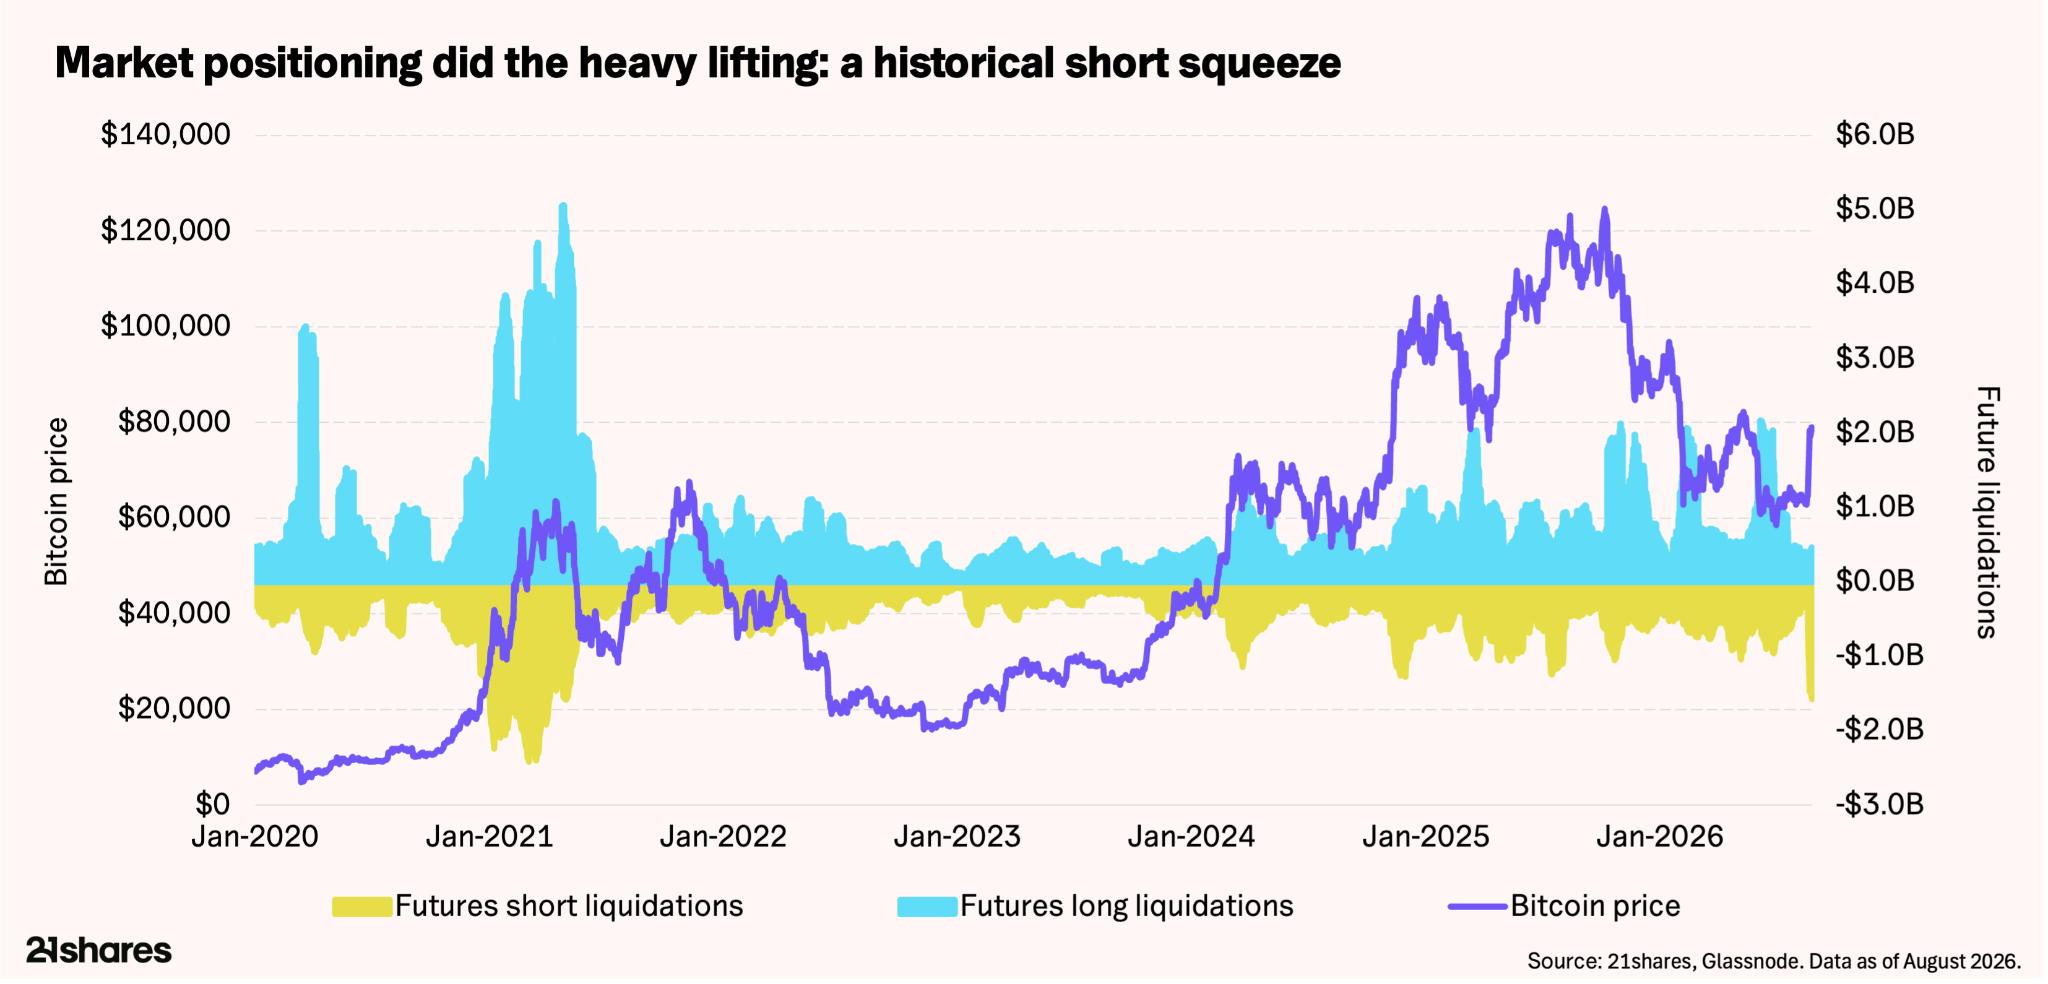
Roughly $1.4 billion of BTC shorts were liquidated, one of the largest short liquidations in crypto's history. US spot bitcoin exchange-traded funds (ETFs) took in over $3.05 billion in August, their strongest month since October 2025, with about $1 billion absorbed in the first two weeks. Investor sentiment swung from fear to greed in under a month, the sharpest flip of the year. The rally was broad: ETH reclaimed the $2,000 level and was trading near range-bound between $2400 and $2500, SOL rallied from the low $70s where it had been stuck for over a month to reach $110, and Hyperliquid jumped around 25% on the CFTC comments.
Bitcoin has cleared resistance, but the hard work starts at $81,000
Trend structure: repaired, but at the hurdle
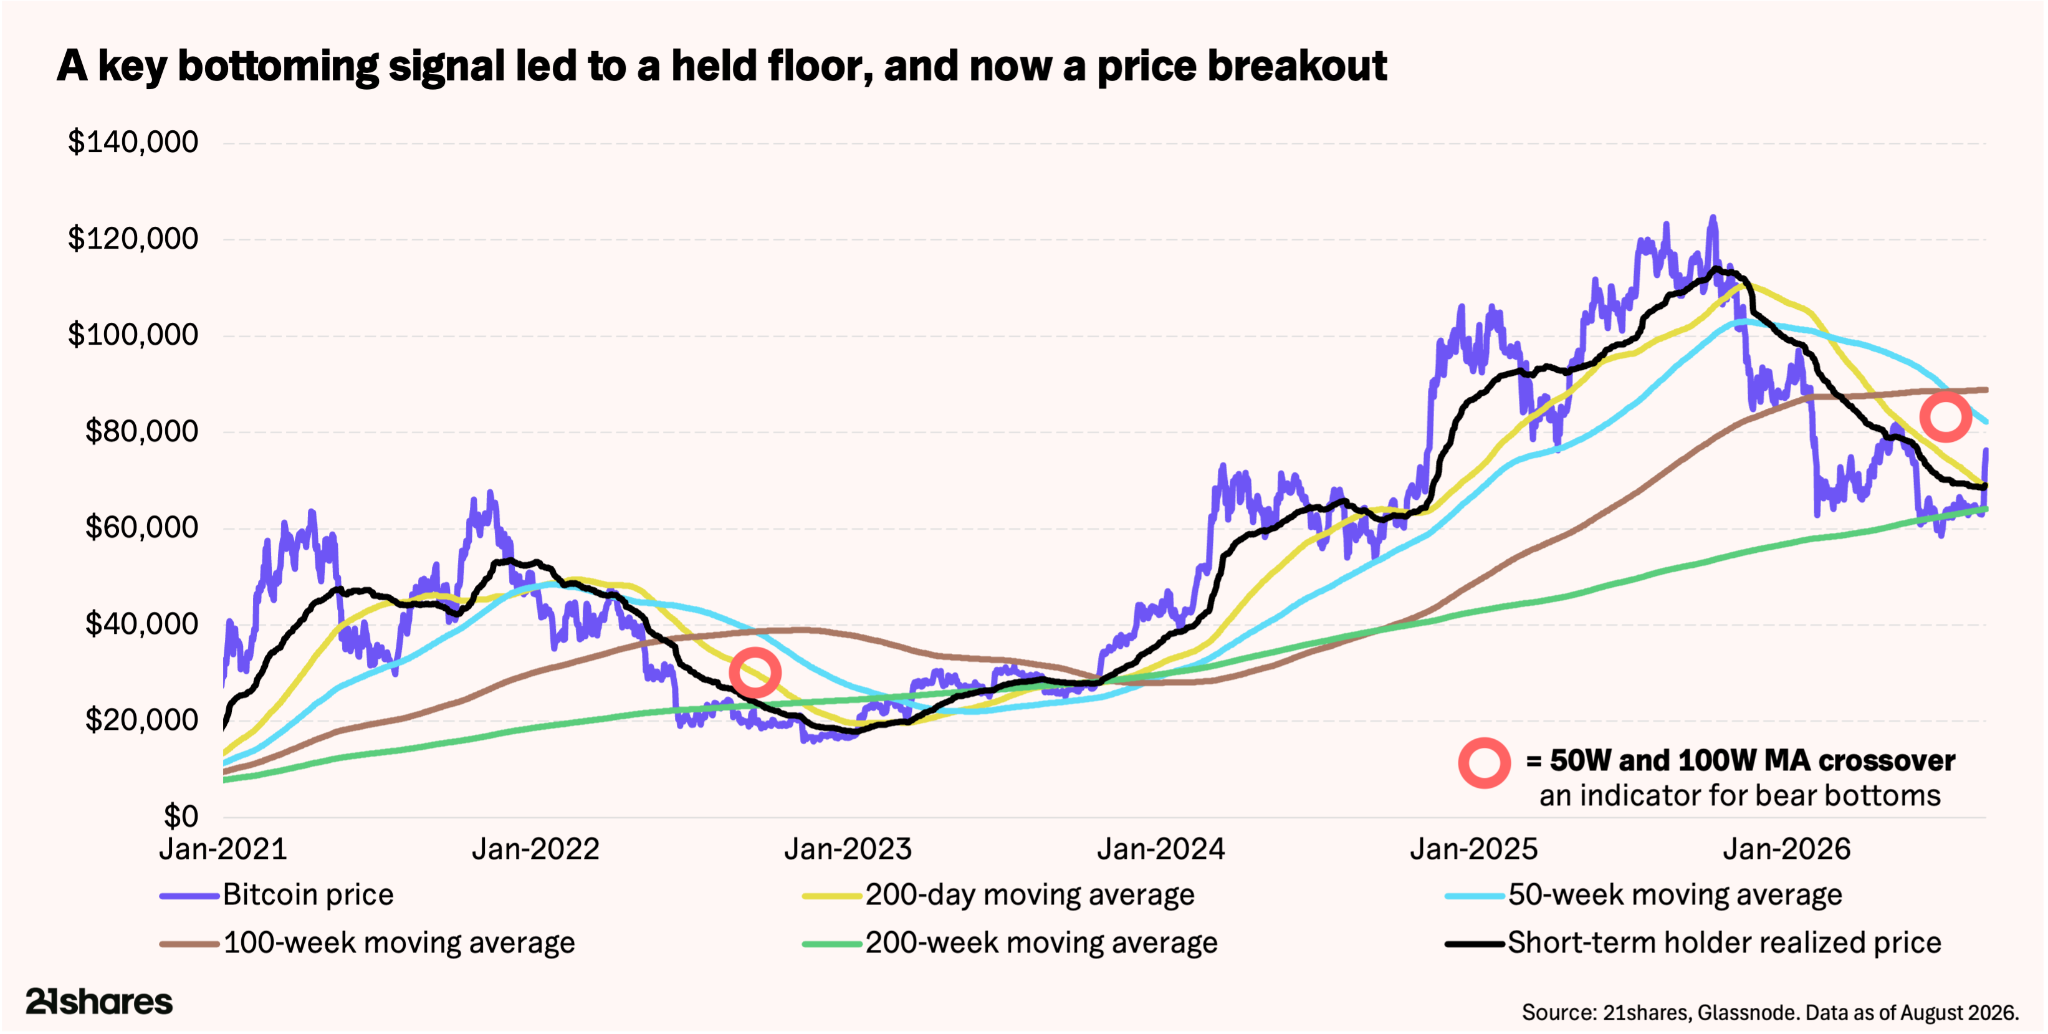
Bitcoin now trades well above its 50-day and 200-day moving averages and sits roughly 20% and 46% respectively above its long-term anchors: the 200-week average near $65,500 and the average investor's purchase price at $53,000, known as the realized price. It is pressing into its 50-week moving average around $81,000, the same $81,000-$82,000 band that rejected price earlier this year and sent it back to the $57,000-$58,000 lows. The $82,500 level also serves as the cost basis for US bitcoin ETF holders, making it an important level: if ETF holders hold above this level, it signals where the broader market expects bitcoin to go from here. That confluence makes this the single most important resistance on the chart. A weekly close above it is what separates a trend recovery from a bear-market bounce. After tagging roughly $81,500, price has consolidated between $77,000 and $79,000.
Momentum: strong, but too hot to chase
Bitcoin's Relative Strength Index (RSI), a momentum measure that signals whether an asset is overbought or oversold on a scale of 0 to 100, reached the low 80s last week, its most elevated reading of the year. When a market first breaks out of a range, an extreme RSI usually reflects the force of the initial move, and price tends to work it off by consolidating sideways. The implication is that the easy part of the move is behind us: buying here means paying top-of-range prices directly below the $81,000-$82,000 resistance. The better entry is on a pullback into the $76,000-$78,000 support band, rather than a chase at the highs.
Immediate support is the $76,000-$78,000 breakout band
It has now flipped to support after serving as a key resistance level for much of the summer. Holding this range keeps the breakout intact. Below that sits $68,500 (the short-term holder cost basis, which separates recent buyers sitting on gains from those sitting on losses), then $65,000, then $60,000 at the 200-week average. Above, $81,000-$82,000 is the hurdle; through it, $85,000 opens, and beyond that the $98,000 yearly high becomes the conversation again.
Derivatives: warm, but not hot
Perpetual funding sits near roughly 10% annualized, positive, but well below the readings associated with crowded longs. Futures open interest tells the same story: at roughly $54 billion, it has picked up off the year's lows through the rally, but still sits 23% off the $70 billion peak reached at last year's bull market top and is currently near the lower end of its yearly range. Euphoria is returning slowly, and that is a positive signal. Since the breakout, bitcoin has been carried mostly by spot demand rather than leverage, leaving room to build higher without the crowded positioning that made the last cycle's top fragile. What the market needs from here is continued spot follow-through, and a cooler derivatives complex is the base you want it to build from.
Breadth: quality is leading, and that is what a sustainable turn looks like
The ETH/BTC ratio (which measures how ethereum is performing relative to bitcoin) is back above 0.03 for the first time in nearly four months. That level matters: it held as the ratio's floor for years, broke down to 0.024 in this spring's washout, and was reclaimed in mid-June, a sign sellers could not keep it muted. ETH has since cleared the area where April's rebound failed, and SOL's rally came with improving onchain activity. This kind of rotation into the strongest majors is how recoveries start, not how bear-market bounces end.
Five factors that will determine whether August's rally holds in September
The Fed and Treasury tug of war
The defining tension is that the two arms of US policy are pulling in opposite directions: the Treasury starts easing the long end when its enlarged buybacks go live, while the Federal Open Market Committee (FOMC) is still debating hikes. With Core Personal Consumption Expenditures (PCE) coming in slightly hotter than expected and Federal Reserve Chair Kevin Warsh’s comments at the Jackson Hole Economic Symposium keynote on August 28 more hawkish than anticipated, traders are pricing in a 65% chance of a rate hike at the September FOMC meeting. However, a hawkish Fed can't offset a widening deficit and mounting questions over its own independence, which seems to be the reason the market is pricing in the debasement trade once again. The scoreboard for this contest is the 30-year yield once operations begin.
15 September: the CLARITY Act vote
Polymarket puts passage this year around 13%, so failure is largely priced in, and passage would be the upside surprise. The 2024 election is the template: binary catalysts move price fastest when the odds shift, not when the result lands. Either way, the SEC and CFTC rulemaking track runs in parallel as a fallback option, though not a regulatory substitute.
Durable ETF flows vs. potential profit-taking activity
August's $3.05 billion of ETF inflows arrived with bitcoin roughly 35% below its all-time high, suggesting investors are committing capital at a meaningful discount rather than chasing a high. Pulling the other way: after a roughly 25% month, the short-term holders' breakeven has risen quickly toward spot, and price is hovering just above the 200-day average and the breakout band. That is exactly the zone where investors without long-term conviction take chips off the table, and it is already happening: since the breakout, short-term holders have sent over $500 million per day of profit-held BTC to exchanges, roughly four times the August pace before it and the heaviest profit-taking since last December. September's flow prints will tell us which side is winning: if ETF demand keeps absorbing the profit-taking, dips stay shallow; if it fades after the sentiment flip, the downward retest comes sooner.
A resurgence of onchain activity
The rally was not just a macro and positioning story; it was backed by a genuine pickup in network usage, with several chains posting fundamental catalysts that lined up with their price action.
Ethereum’s valuation is finally catching up to its fundamentals
ETH reclaimed the $2,000 level, and the ETH/BTC ratio is back above 0.03 after bottoming in mid-June. Confirmation sat at about $2,450, where April's rebound failed, and ETH is now trading around it. The pattern to remember: ETH tends to trade flat for months and then move in concentrated bursts, as in summer 2024 and 2025, so tactically it is the asset that tends to move most sharply when market conditions turn. The fundamentals underneath support the move, a divergence we unpack in our Ethereum H1 2026 earnings analysis: fee revenue fell 69% year-over-year as speculation dried up, yet usage kept compounding. Monthly active addresses up 15% year-over-year to 8.4 million, smart-contract deployments up 74% to over 1.3 million, and stablecoins on Ethereum up 22% to roughly $156 billion, alongside roughly 47% of the $34 billion tokenized real-world asset market. The network still commands 54% of all crypto total value locked (TVL), the combined value of assets deposited across its applications, despite representing just 32% of the altcoin market cap; its economic weight is running well ahead of its valuation. That gap is what institutions are organizing around: two institutional initiatives launched in July to bring large investors onto Ethereum's infrastructure, and ETH ETF inflows have outpaced bitcoin's on a market-cap-adjusted basis since July (Bloomberg, August 2026).
Solana's governance is engineering scarcity just as activity hits record highs
The network logged its strongest week of decentralized exchange (DEX) activity, where traders swap crypto directly without a centralized intermediary, in over six months, clearing more than $20 billion of spot DEX volume in a single week: a sign that activity has returned across the market. It also recorded its highest weekly transaction count ever, at 1.17 billion in the second week of August, roughly 20% above the volume seen during its Trump-coin launch week. Solana's market share of spot DEX volume across all blockchains currently sits at 40% and has grown roughly 30% year-over-year, as discussed in our latest Solana H1 2026 earnings analysis. On the governance side, SIMD-550 passed in the form of SGP-002,this proposal will halve the network's yearly inflation and bring Solana to its 1.5% terminal inflation rate by 2029, roughly three years ahead of the original schedule. The near-term trade-off is lower staking yield, but comparable supply-reduction upgrades on other chains have historically been read as a positive supply signal, and the cut is partly intended to push capital out of staking and into Solana's onchain economy, where the activity above is already picking up. Our full analysis of the Solana SIMD-550 governance proposal examines the trade-offs in detail.
Hyperliquid's biggest revenue catalyst hasn't even arrived yet
The world's largest decentralized perpetual futures exchange drew the headline that the CFTC is working to bring it into US regulatory frameworks, but the fundamentals were moving underneath the story too. In the third week of August, it posted its highest weekly revenue since the week of bitcoin's all-time high last October, taking in over $24 million; that figure exceeds what the next three largest perpetual futures exchanges generated combined over the prior two months. The chain is also on track for its busiest month since October 2025, with August volume approaching the mid-$200 billion range. Looking ahead, the bigger catalyst may still be in front of it. As discussed in our recently published Hyperliquid H1 2026 earnings analysis, under an agreement struck in May with Circle and Coinbase, roughly 90% of the treasury yield on the over $5.4 billion of USDC held on Hyperliquid will be redirected toward the protocol and used for HYPE buybacks. By our estimates, that could add $135 to $160 million in annual revenue, close to 18% of current core revenue (this is a projection based on current conditions; actual outcomes may differ). The first payment is expected to flow in early October.
The cycle clock: weakness would be the late-bear stage
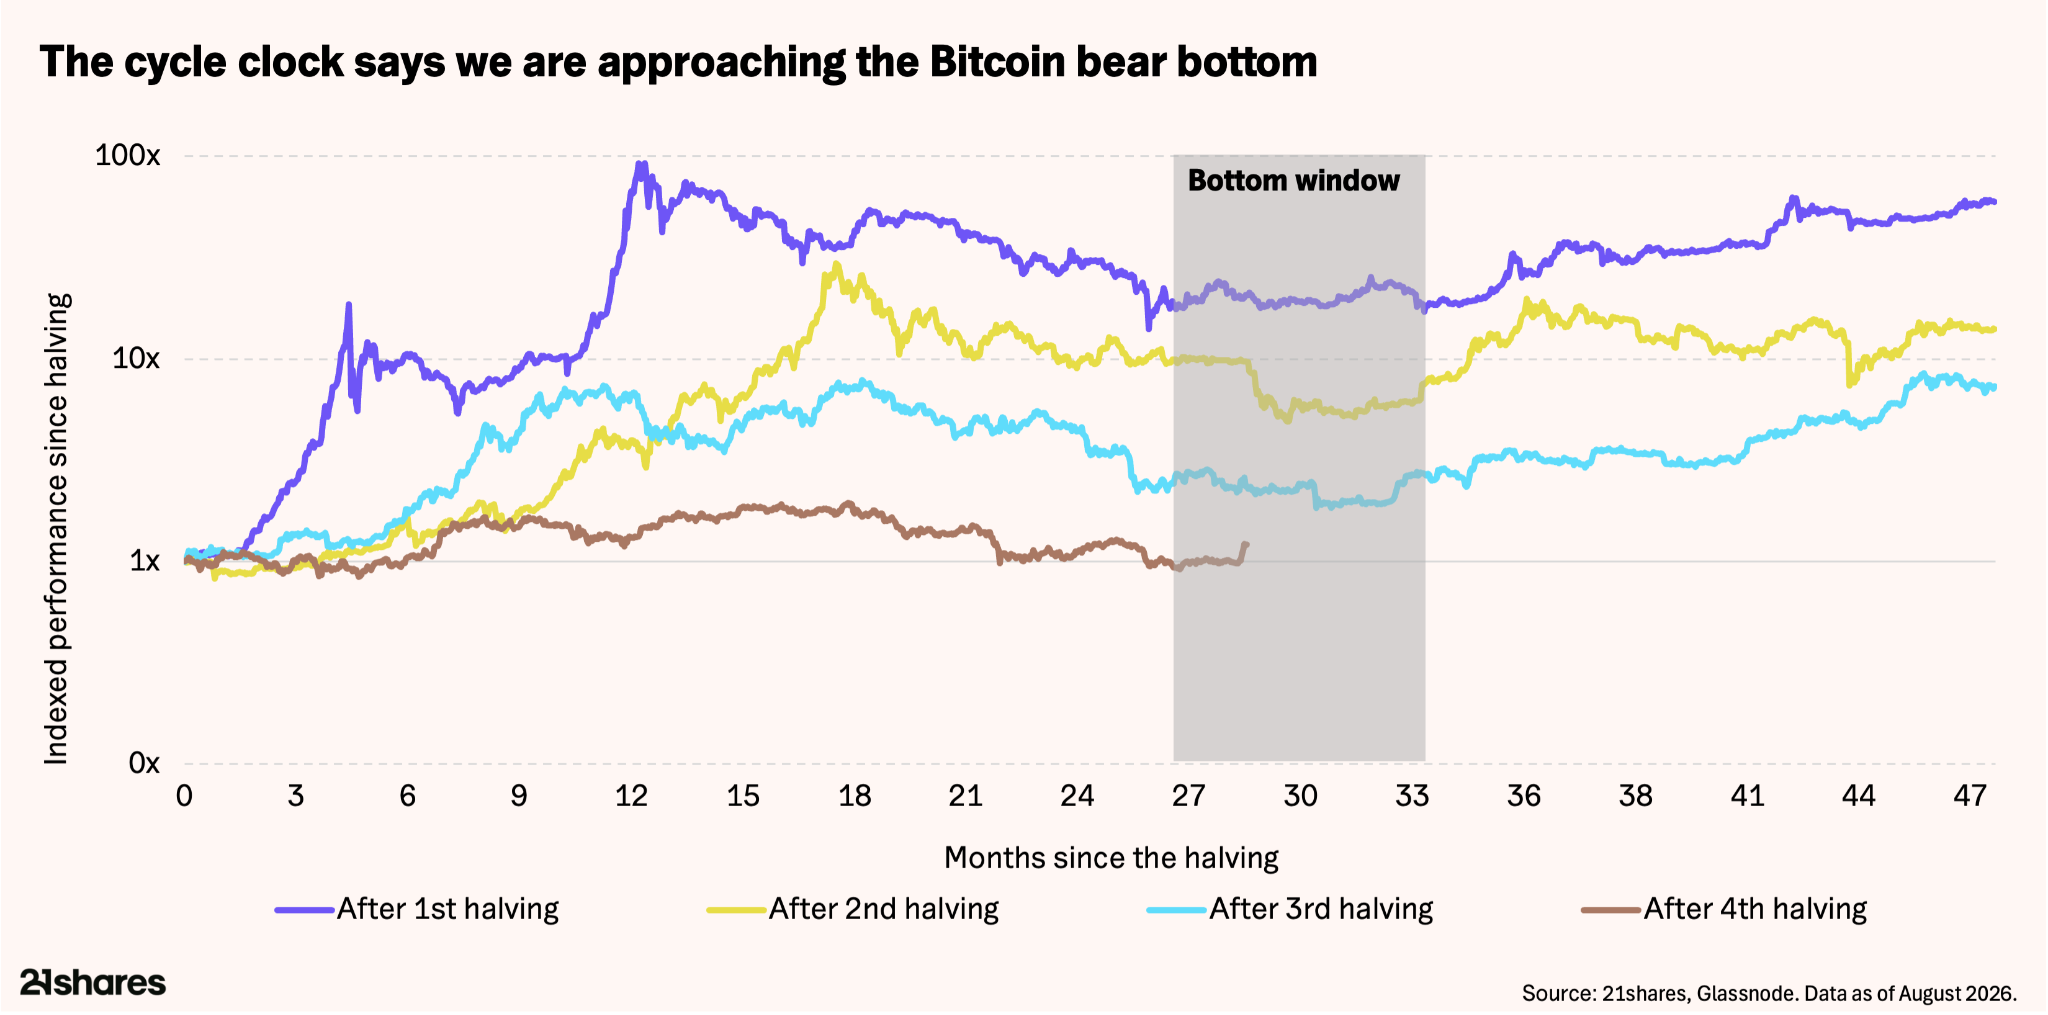
We are now roughly ten months past the October 2025 peak, firmly inside the window in which bitcoin has historically bottomed. The bottom-marking indicators have also been flashing for weeks: the Market Value to Realized Value ratio (MVRV), a measure that compares bitcoin's current price to the average price at which all coins last moved, used to gauge whether the market is overvalued or undervalued, is near levels associated with prior cycle lows, alongside signs of seller exhaustion onchain and large holders accumulating even as the share of investors in profit fell, a convergence last seen near the 2020 and 2022 bottoms. None of this rules out another leg of weakness; it tells us what that weakness would mean. If the bear case plays out, we would read it as a late-cycle retest near the end of the bear market, not the start of a prolonged down period.
What to expect: bull and bear scenarios
Bull case: the follow-through arrives
The ingredients are straightforward. Bitcoin holds the $76,000-$78,000 support band, Warsh portrays a neutral tone and keeps rates steady or cuts, the Treasury buybacks launch cleanly, and ETF inflows extend into September. Each of these keeps the liquidity story intact; together, they give the market the conviction to break $81,000-$82,000. Through that level, $85,000 opens quickly, and a retest of the $98,000 yearly high into Q4 becomes possible.
The CLARITY vote adds optionality on top: with passage priced at only roughly 13%, a failed vote is already expected, while a surprise passage would be an additional catalyst. Crucially, this is what the exit from a bear market is supposed to look like: a catalyst landing inside the historical bottoming window, with long-term anchors reclaimed and investors already positioned. Follow-through from here would confirm that the bear market that began in October 2025 ended in this window, with the rally broadening as liquidity slowly rotates into the majors with the strongest fundamentals.
Bear case: the trade stalls
A large share of August's move was positioning: the rally was turbocharged by one of the largest short squeezes in crypto's history, and squeezes borrow buying power from the future. If that was most of the story, the market is now full of fresh longs sitting on fast profits, exactly the setup where profit-taking snowballs. Add any negative catalyst (a rate-hike at the September FOMC meeting, long-end yields rising despite the buybacks, a reignition of geopolitical uncertainty in the Middle East, or ETF inflows drying up after the flip to greed), and the path down is clear. Bitcoin loses the $76,000-$78,000 band, selling cascades to $68,500 at the short-term holder cost basis, and if that gives way, $65,000 and then $60,000 at the 200-week average and realized price come back into view. In that world, August goes down as a bear-market bounce rather than the immediate end of the bear market. But note what this scenario is not: with the cycle clock this deep into the bottoming window and the bottom signals already flashed, even the bear case describes the final act of this bear market rather than the start of a new one.
August moved our thesis from future tense to present tense
For most of this year, our thesis lived in the future tense: signals clustering in bottom territory, waiting on a catalyst. August moved it into the present. The catalyst arrived, long-term anchors were reclaimed, and the market absorbed a massive short liquidation without breaking structure. The timing of this rally matters as much as its size. We are inside the window where every prior bitcoin bear market has ended. Both scenarios ultimately lead to the same place; they differ only on the route and the timing. That is why we would treat any weakness from here as a late-cycle retest to be bought, not a reason to step away.
From here, we are watching three things, in order: bitcoin holding $76,000-$78,000 on any retest, ETF inflows persisting after the sentiment flip, and long-end yields staying contained once the buybacks begin. If those hold, clearing $81,000-$82,000 is a matter of when. For investors building a long-term position in bitcoin, prior cycles suggest these levels have historically been meaningful entry points, though past cycles are not a guarantee of future outcomes, and bitcoin remains a highly volatile asset.
FAQ
Why did bitcoin go up in August 2026?
Bitcoin rose roughly 25% in August 2026, driven by three factors: the US Treasury's decision to double the size of its long-end bond buyback operations (read by markets as a signal that scarce assets like bitcoin would benefit), Washington's accelerating crypto policy agenda (including a proposed SEC framework and CFTC engagement with Hyperliquid), and a large short squeeze that liquidated approximately $1.4 billion in leveraged bets against bitcoin.
Is $81,000 a key resistance level for bitcoin?
Yes. The $81,000-$82,000 zone is the most significant resistance level on the chart as of late August 2026. It is where bitcoin's 50-week moving average sits, it is the level that rejected bitcoin's earlier rally this year and sent it back to the $57,000-$58,000 range, and it is close to the cost basis of US bitcoin ETF holders. A sustained weekly close above this zone would signal a trend recovery rather than a bear-market bounce.
What is the CLARITY Act and why does it matter for crypto?
The CLARITY Act is US legislation designed to establish a clearer regulatory framework for digital assets, with a procedural Senate vote scheduled for 15 September 2026. Prediction markets put its passage this year at around 13%, so failure is the base case and is largely priced in. A surprise passage would be an unpriced catalyst for crypto prices; even without passage, the SEC and CFTC are pursuing rulemaking in parallel that could achieve similar results over a longer timeline.
What are bitcoin ETF inflows telling us about the market?
US spot bitcoin ETFs pulled in over $3.05 billion in August 2026, their strongest month since October 2025. Notably, this inflow came with bitcoin roughly 35% below its all-time high, suggesting investors are building positions at a discount rather than chasing a top. The key question for September is whether this inflow pace continues after the sentiment shift from fear to greed, or whether profit-taking by short-term holders outpaces new demand.
What would a bitcoin bear case look like from here?
The bear case is that August's move was driven primarily by a short squeeze rather than new spot demand. If a hawkish Federal Reserve meeting in September, rising long-end yields, or fading ETF inflows reverse the momentum, bitcoin could lose the $76,000-$78,000 support band and fall toward $68,500, then $65,000, and potentially $60,000. Even in this scenario, the bear case is a late-cycle retest rather than the start of a new sustained decline, given how deep we are in the historical bottoming window.