

Additional contributions by Adrian Fritz and Eliézer Ndinga
It’s important to understand the context of Bitcoin’s drawdown, focusing on the cause rather than the size. The sell-off began on October 10 when a surprise US 100% tariff on Chinese imports triggered a flash crash that wiped $19 billion of leveraged positions in 24 hours – nine times any prior single-day record – and collapsed perpetual futures open interest by 43%.
What followed was driven by macro, not crypto: sustained tariff pressure, the energy shock from the Strait of Hormuz closure, and a hawkish pivot at Kevin Warsh’s first FOMC as Fed chair, sending two-year yields to twelve-month highs. US spot Bitcoin ETFs saw $2.5 billion of outflows in June, but most of that reads as a mechanical basis-trade unwind – passive, long-only holders kept adding throughout.
4 reasons that make the case for Bitcoin’s entry point
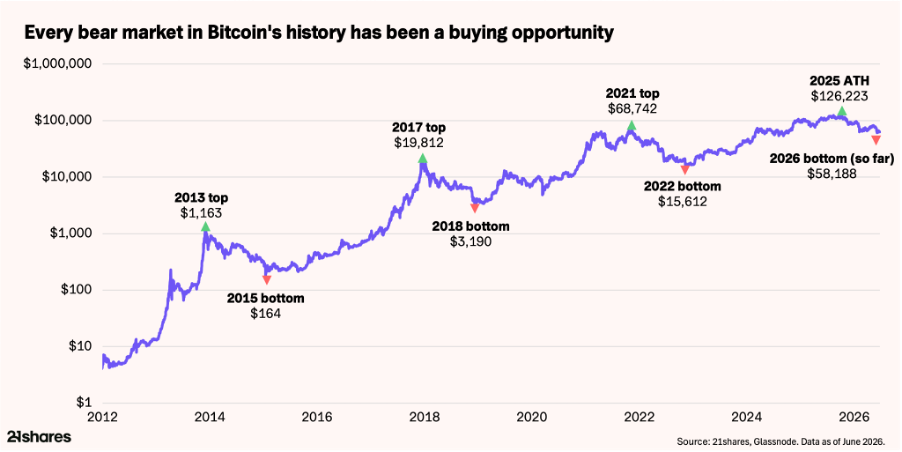
Every bear market in Bitcoin’s history has been a buying opportunity. The current price (~$60,000) sits ~50% below the October 2025 all-time high of $126,223, placing it within the historical bottom range across all four completed cycles. Green triangles mark cycle tops; red triangles mark cycle bottoms.
1. Cyclically, we’re entering bottom territory
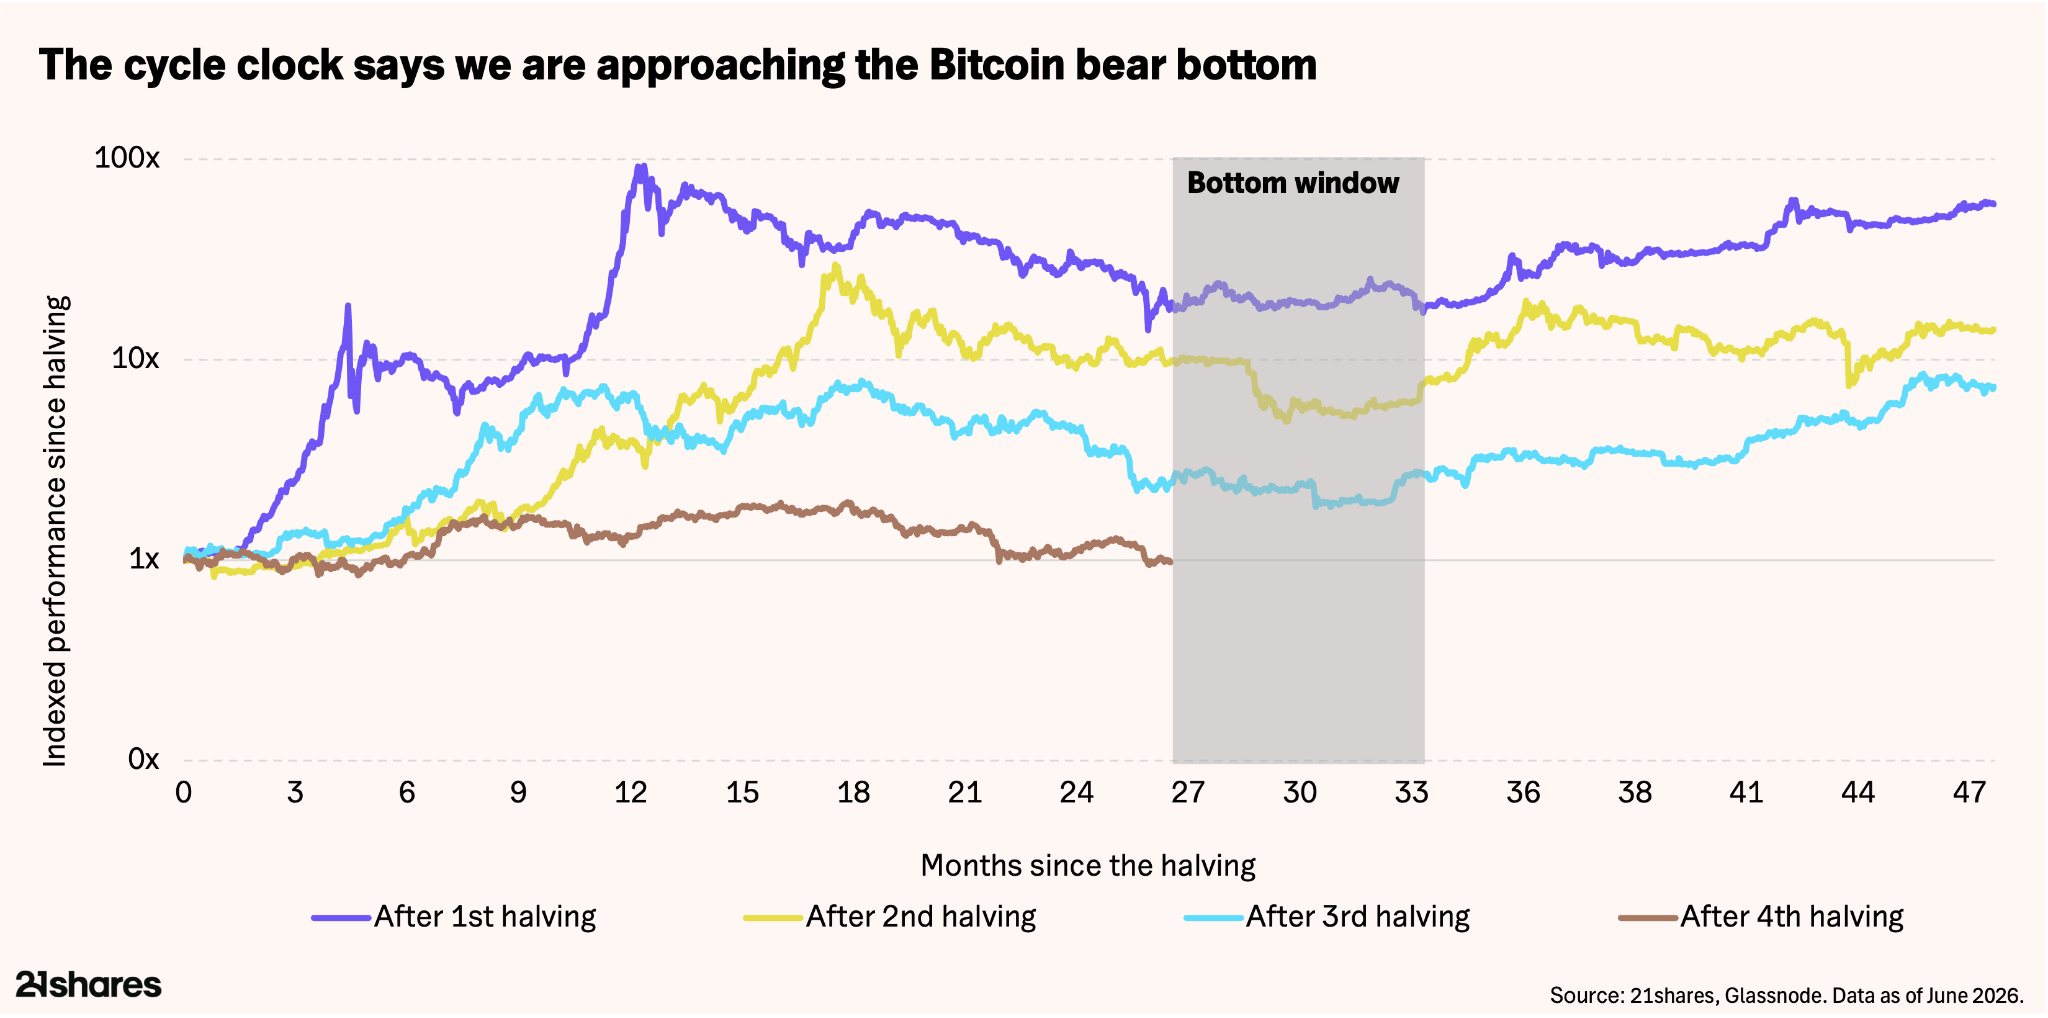
Multiple independent signals have converged at levels that have historically marked cycle bottoms, not deeper collapses. Roughly eight months past the October top, Bitcoin is entering the window where all three prior cycles bottomed – around one year after peak and 2.5 years after the halving. Buying anywhere in this window has returned ~130% to the next halving on average, without needing to catch the exact low.
2. Valuation and investor stress match past cycle lows
The median holder has slipped to a level reached at every prior cycle bottom and never at the start of a deeper decline. Red circles mark each prior instance where this level was reached – all coincided with cycle bottoms.
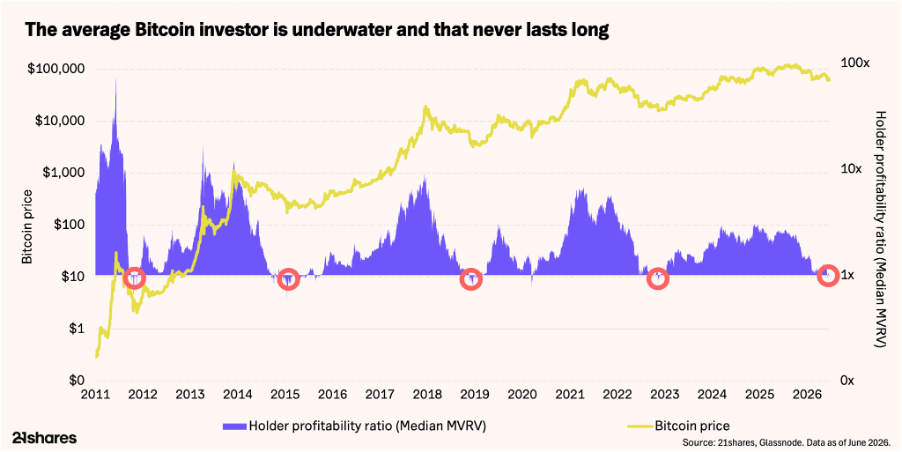
For the first time this cycle, the median holder profitability ratio (Median MVRV) has returned to 1x, meaning the average investor is at breakeven. Critically, the pain is concentrated in recent buyers, not the conviction cohort. Long-term holders are not distributing but adding; their holdings are up roughly $19 billion since the peak and now sitting at all-time-high supply.
3. The downside risk is structurally contained
This is the most underappreciated part of the story, and the reassurance we would give any investor nervous about catching a falling knife.
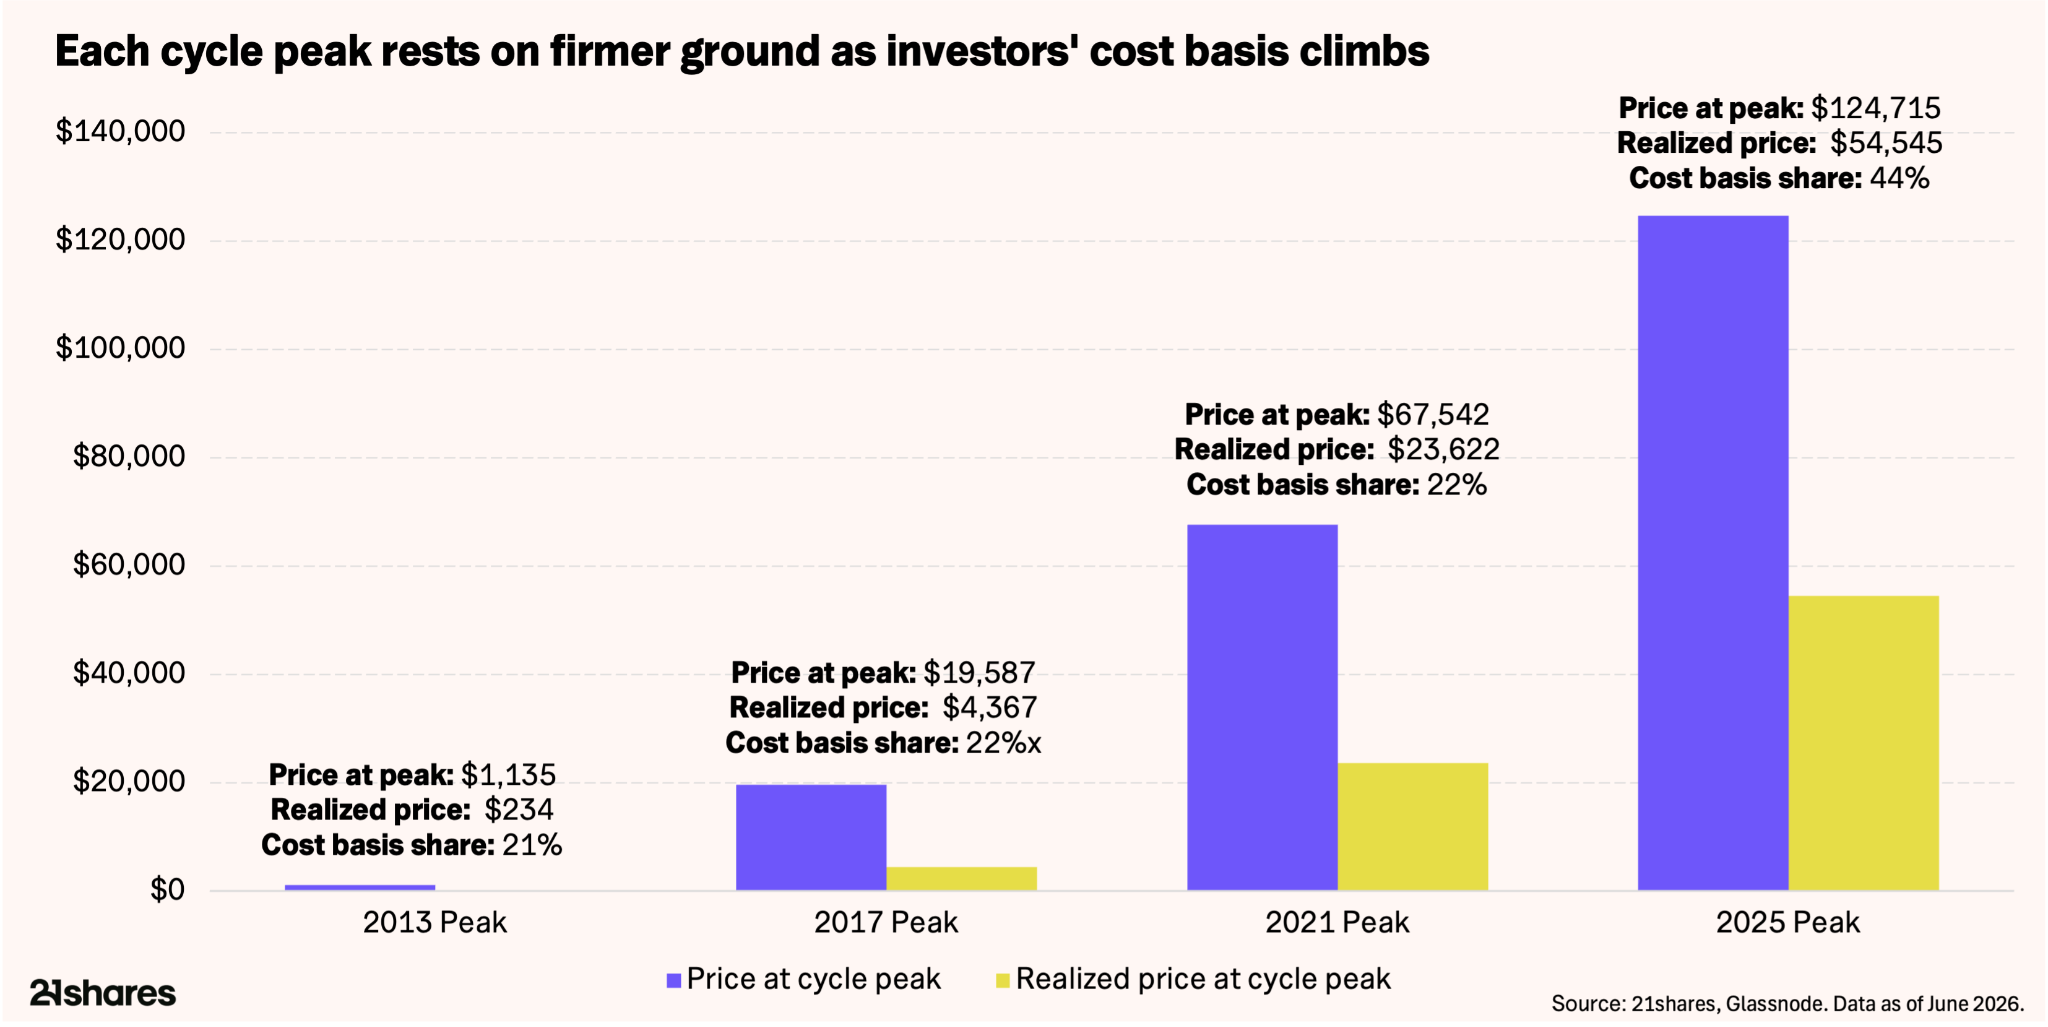
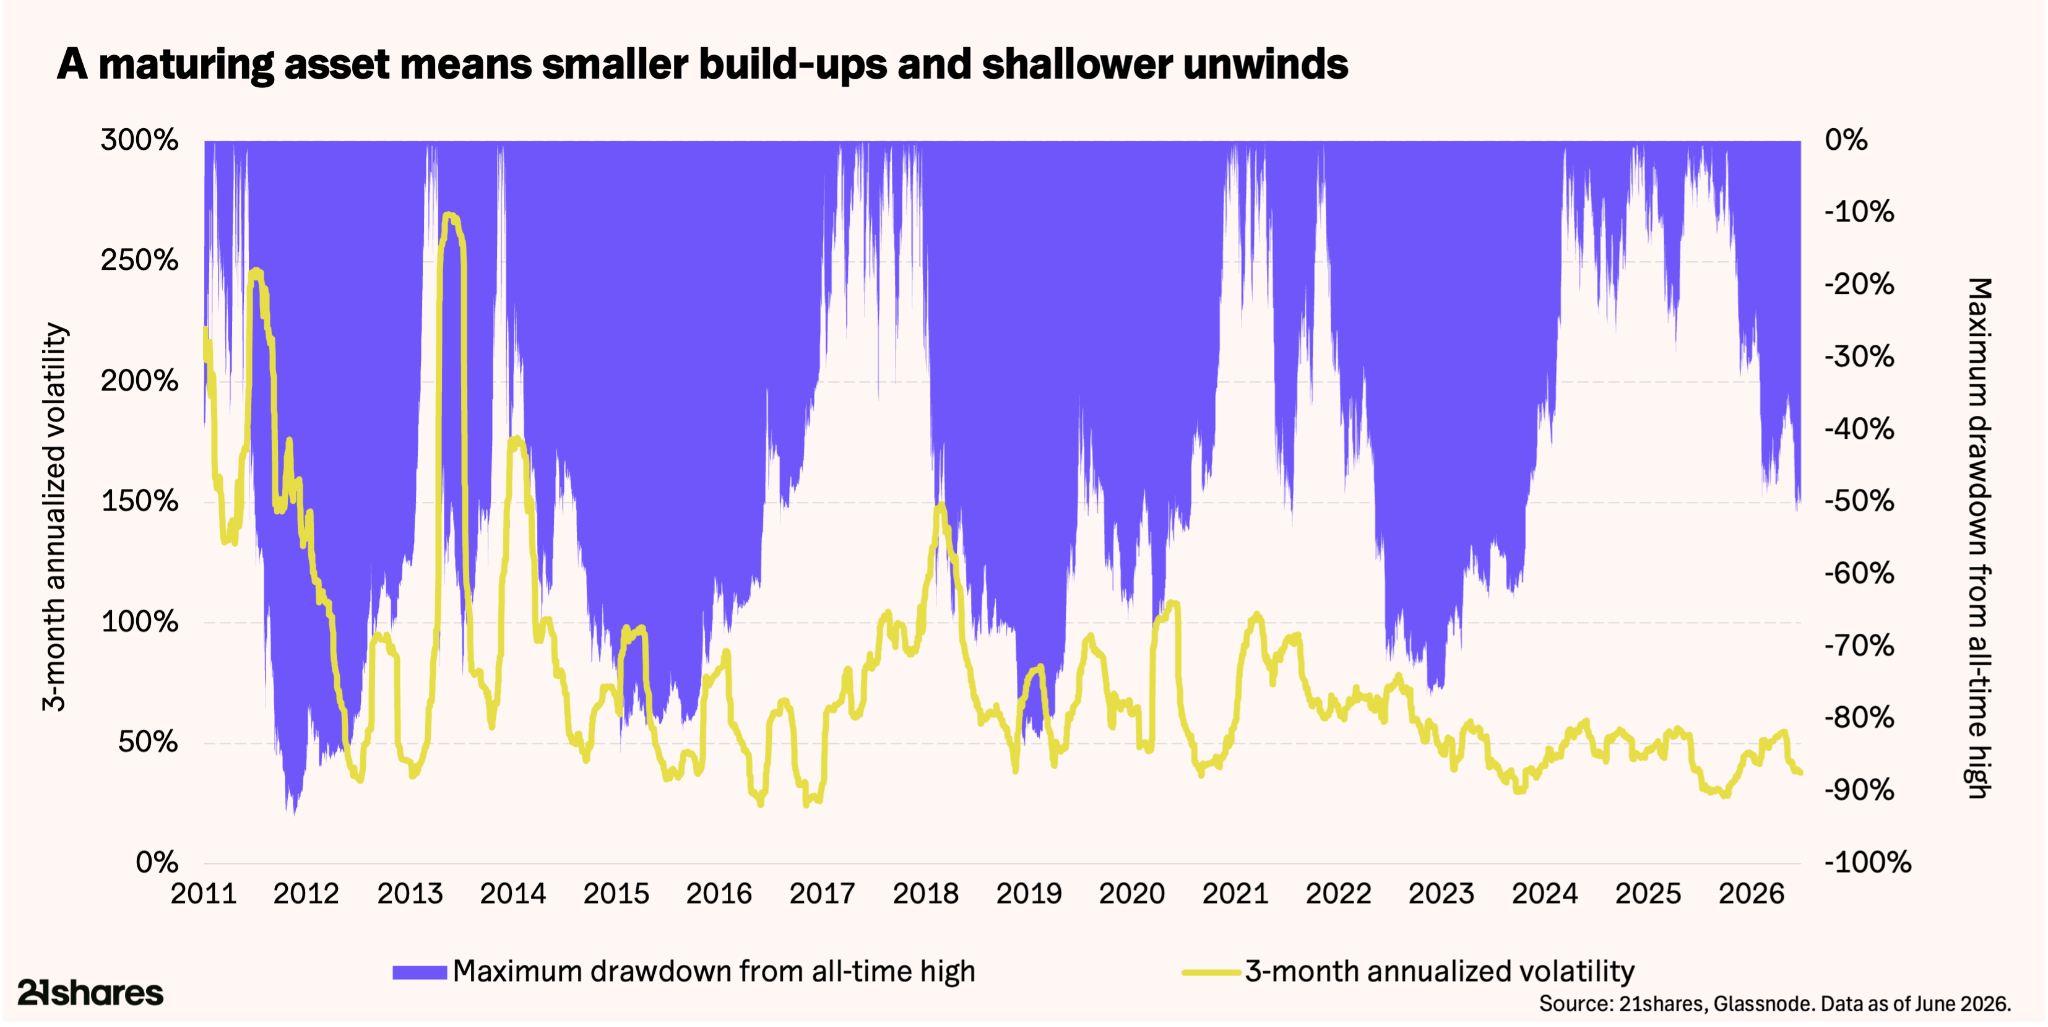
Calmer, institutionally driven cycle tops mean the market's cost basis now sits much closer to the peak: realized price is ~44% of the top this cycle versus ~25% historically, leaving less excess to unwind, mechanically raising the floor. The tape confirms it, with this ~50% drawdown roughly half the 75–85% washouts of prior cycles and volatility compressed to ~40%, half its norm. A repeat of those depths would require a systemic break that is simply not present.
4. Price is ready to break out above long-term anchors
The final lens is the price itself, and it is telling a similar story. Bitcoin is trading right on its 200-week moving average for the first time since 2023, with realized price just beneath. The long-term anchors have acted as support in every prior cycle and have only ever been breached during outright capitulation. Those levels have been tested repeatedly through this drawdown, in February and again in June, and have so far held.
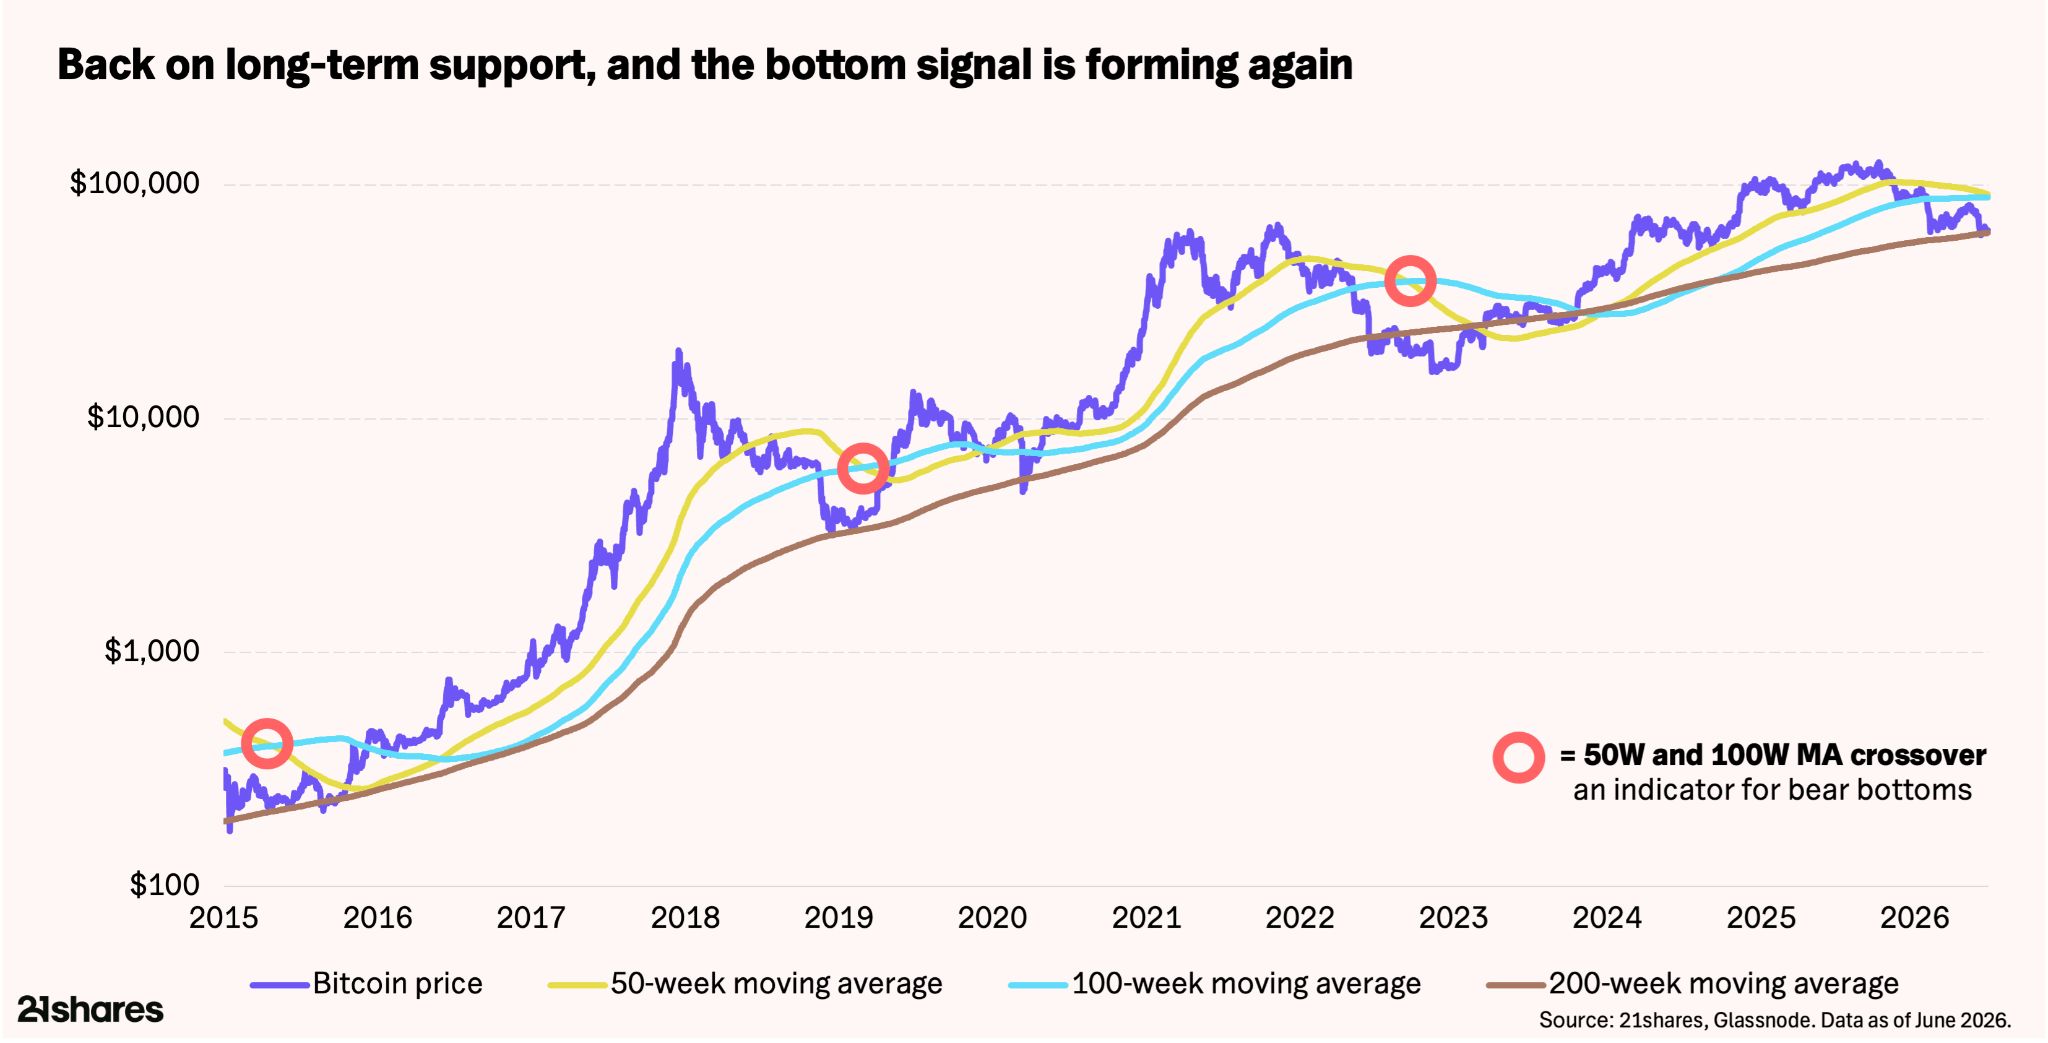
At the same time, the 50-week moving average is converging toward the 100-week, a crossover that has occurred just three times in the last decade, in 2015, 2019, and 2022, each within weeks of a cycle bottom. It is a lagging, coincident signal rather than a leading one, which is precisely the point: by the time these anchors and the crossover align, the low has historically been at hand or already in, reinforcing the case for accumulating now rather than waiting for the all-clear.
Bottom line:
Bitcoin’s fundamentals and demand base are intact
Our base case is a recovery toward $100,000 by year-end as macro pressure eases and capital rotates back to Bitcoin once the IPO calendar clears. The cycle clock, onchain signals, and contained downside all point in the same direction. We would not try to time the exact low – in prior cycles, the all-clear signal arrived well after the bottom was in, and the payoff for being early has been asymmetric. A weekly close below ~$58,000 would open the $50,000–$55,000 zone (realized price).
A return to prior-cycle peak-to-trough depths of 75–85% would imply a worst-case in the low $40,000s – structurally unlikely given the absence of systemic risk and the quality of the current institutional demand base. For investors still on the sidelines, a dollar-cost averaging approach through this zone is the most defensible path.