

Additional analysis by Matt Mena
Bitcoin ended June near $60,000, down nearly 19%, its worst month of the year and its weakest since the collapse of Three Arrows Capital in 2022. The instinct to question the long-term thesis is understandable: is this the start of something worse, or just noise?
The honest answer is not that this drop is meaningless. It is that the cause matters more than the size of the move, and the cause here was mostly mechanical.
What actually happened in June?
Central banks tightened policy sharply after an energy shock pushed up inflation expectations, and that hit risk assets broadly.1 Nasdaq shed $1.13 trillion from its market cap in June, while the S&P 500 lost $560 billion. Dropping $380 billion from digital assets’ total market cap happened alongside a wider risk-off move, not in isolation.
While macro drove much of the move, Bitcoin also carried its own pressures. US spot bitcoin exchange-traded funds (ETFs) saw one of their worst months with over $2.5 billion in outflows in June.2
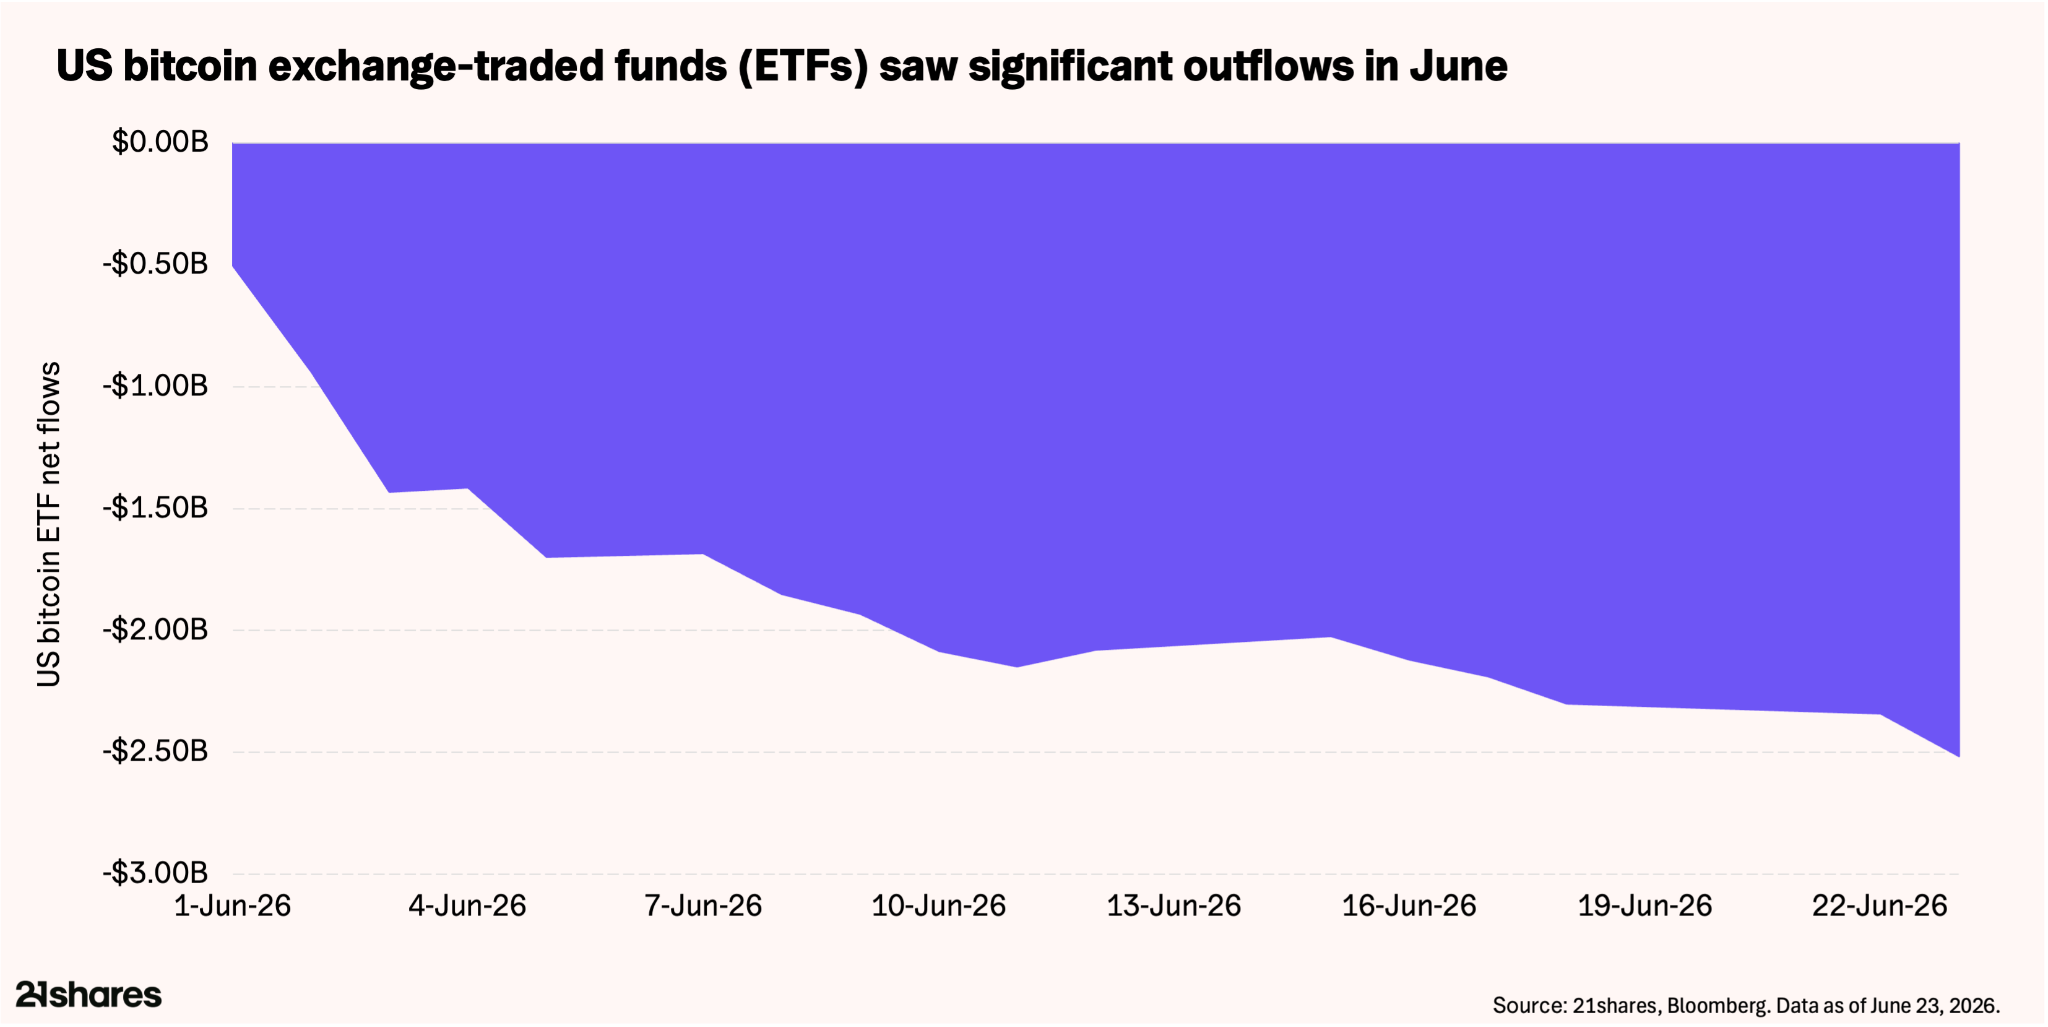
We read most of this as a mechanical unwind of the basis trade: buying the spot bitcoin ETF while shorting bitcoin futures to pocket the price gap between them. That popular trade stopped being profitable as that gap narrowed to around 2% this spring. When a trade like this unwinds, it shows up as selling pressure even though the people closing it were never long-term investors in bitcoin to begin with.
Reinforcing this, on CME, leveraged funds cut shorts from ~100,000 BTC at October’s peak to ~63,000, roughly $2.3 billion unwound as the price fell.3 That distinction matters: the closing of an arbitrage trade is not the same signal as an investor losing conviction.4
Strategy's financing machine seized up too. Its bitcoin accumulation relied heavily on STRC, a preferred stock designed to trade near its $100 face value. By late June it had fallen to ~$87, a record 13% below par, effectively closing that channel.5 The liability remains: ~$17.5 billion outstanding against cash reserves that fell from $2.25 billion in February to $1.4 billion by June. With bitcoin 17% below Strategy's $75,651 average cost and its stock converging toward bitcoin's underlying value, new share issuance is hard to defend, leaving bitcoin sales as a path the market was beginning to price in.
Why a sharp drop doesn’t mean the long-term case is broken
Bitcoin and Ethereum get most of the attention, but the broader onchain picture told a different story in June. Solana captured over 90% of tokenized-equity trading volume during the month, clearing $1 billion, a sign that activity and building continued underneath the price weakness.
Large holders also kept buying into the decline. A market measure tracking whether big holders are net buyers or net sellers climbed from near zero up to a range of 0.85 to 1.0 as bitcoin traded between $60,000 and $64,000, even as the share of investors in profit fell below 50%. The last time these two signals converged (during the March 2020 Covid crash and the Q4 2022 FTX collapse), the market was at or near a cycle bottom, both considerable entry points.6
What history says about drops like this
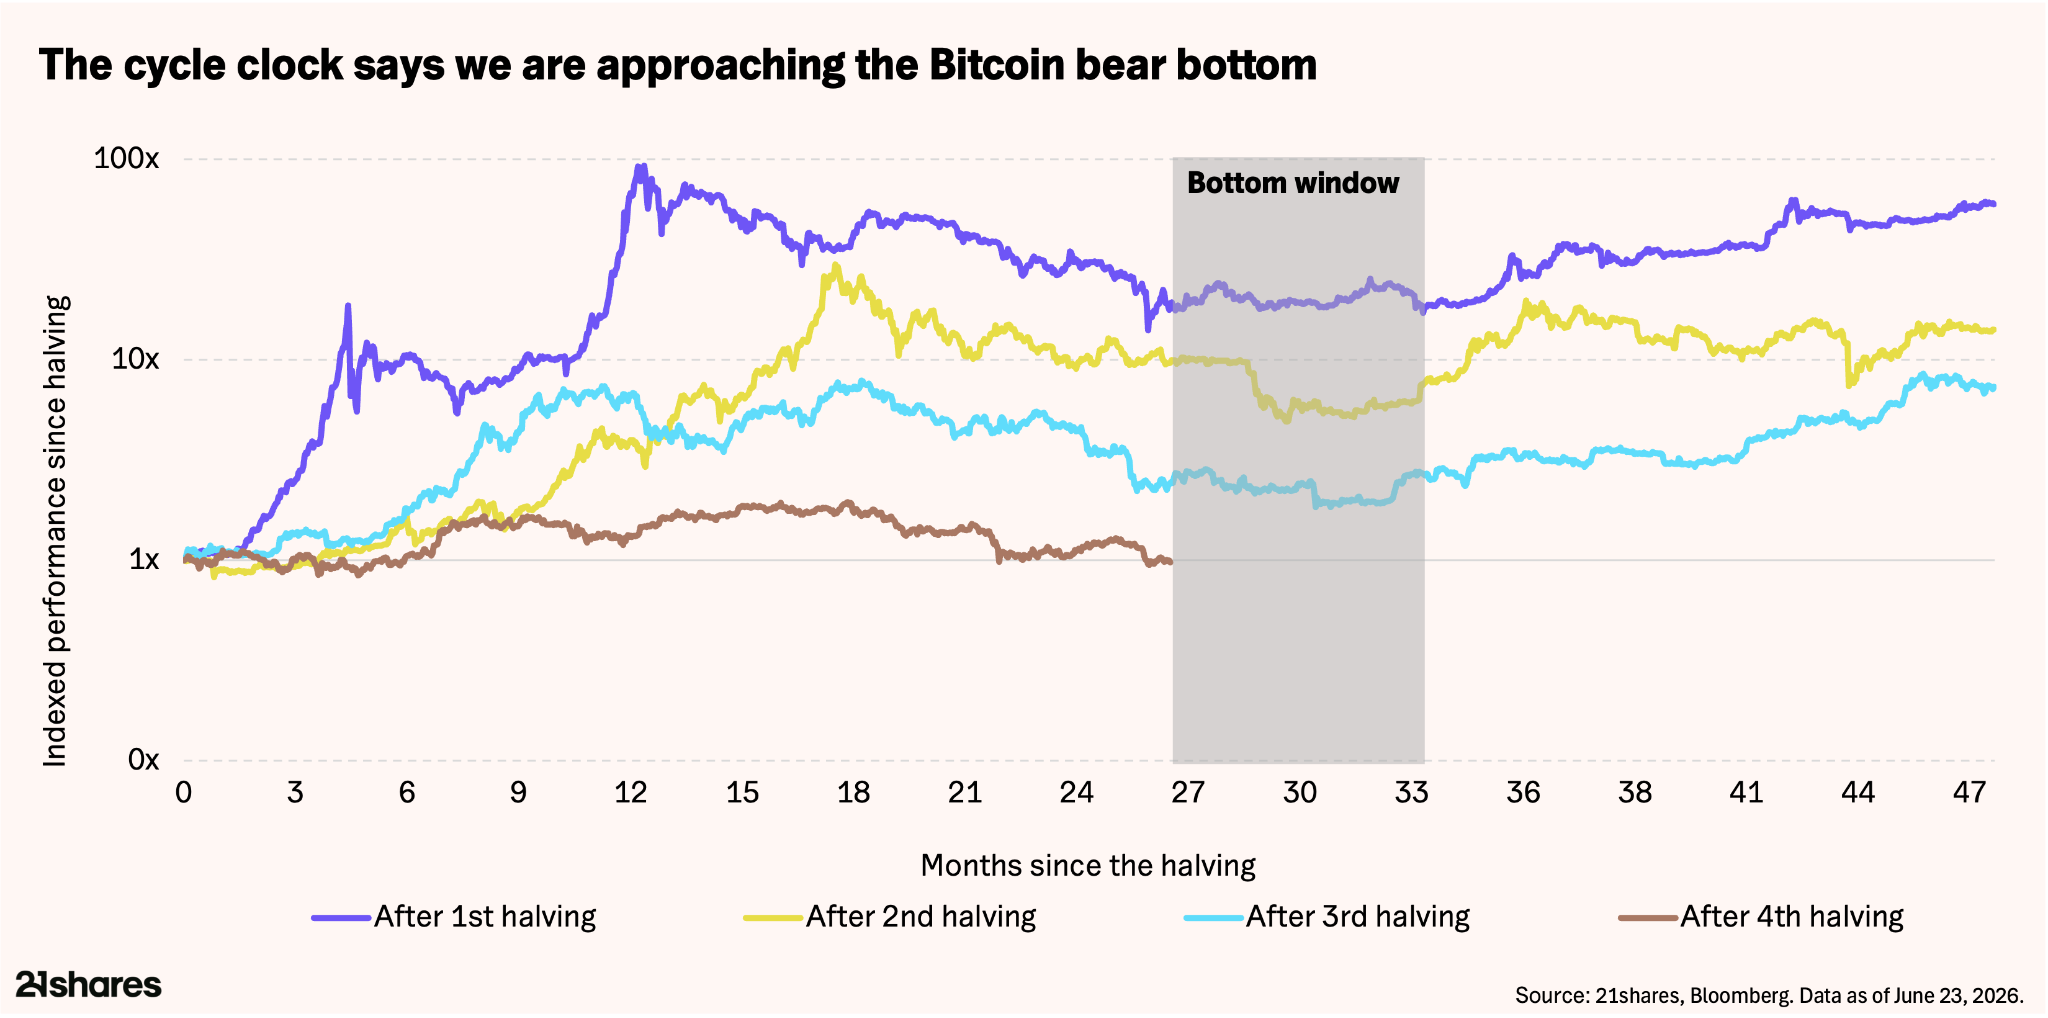
This decline put bitcoin roughly 50% below its prior peak. That sounds severe until you compare it with prior cycles, where peak-to-trough drawdowns of 75% to 85% were the norm before each cycle eventually recovered. A 50% drawdown sits well inside bitcoin's historical range of normal, even though it does not feel that way while living through it.
By the cycle clock, around eight months past October's peak, we are approaching the 11–13 month window in which bitcoin has historically bottomed, a setup that, against the accumulation signal flagged above, increasingly rhymes with prior cycle lows. The cycle remains intact.
What to watch next
Three things will tell you more than any single price move.
The late-July inflation print comes first. A cooler reading, particularly on energy costs, would support the case for Fed easing later this year and remove one headwind from risk assets.7
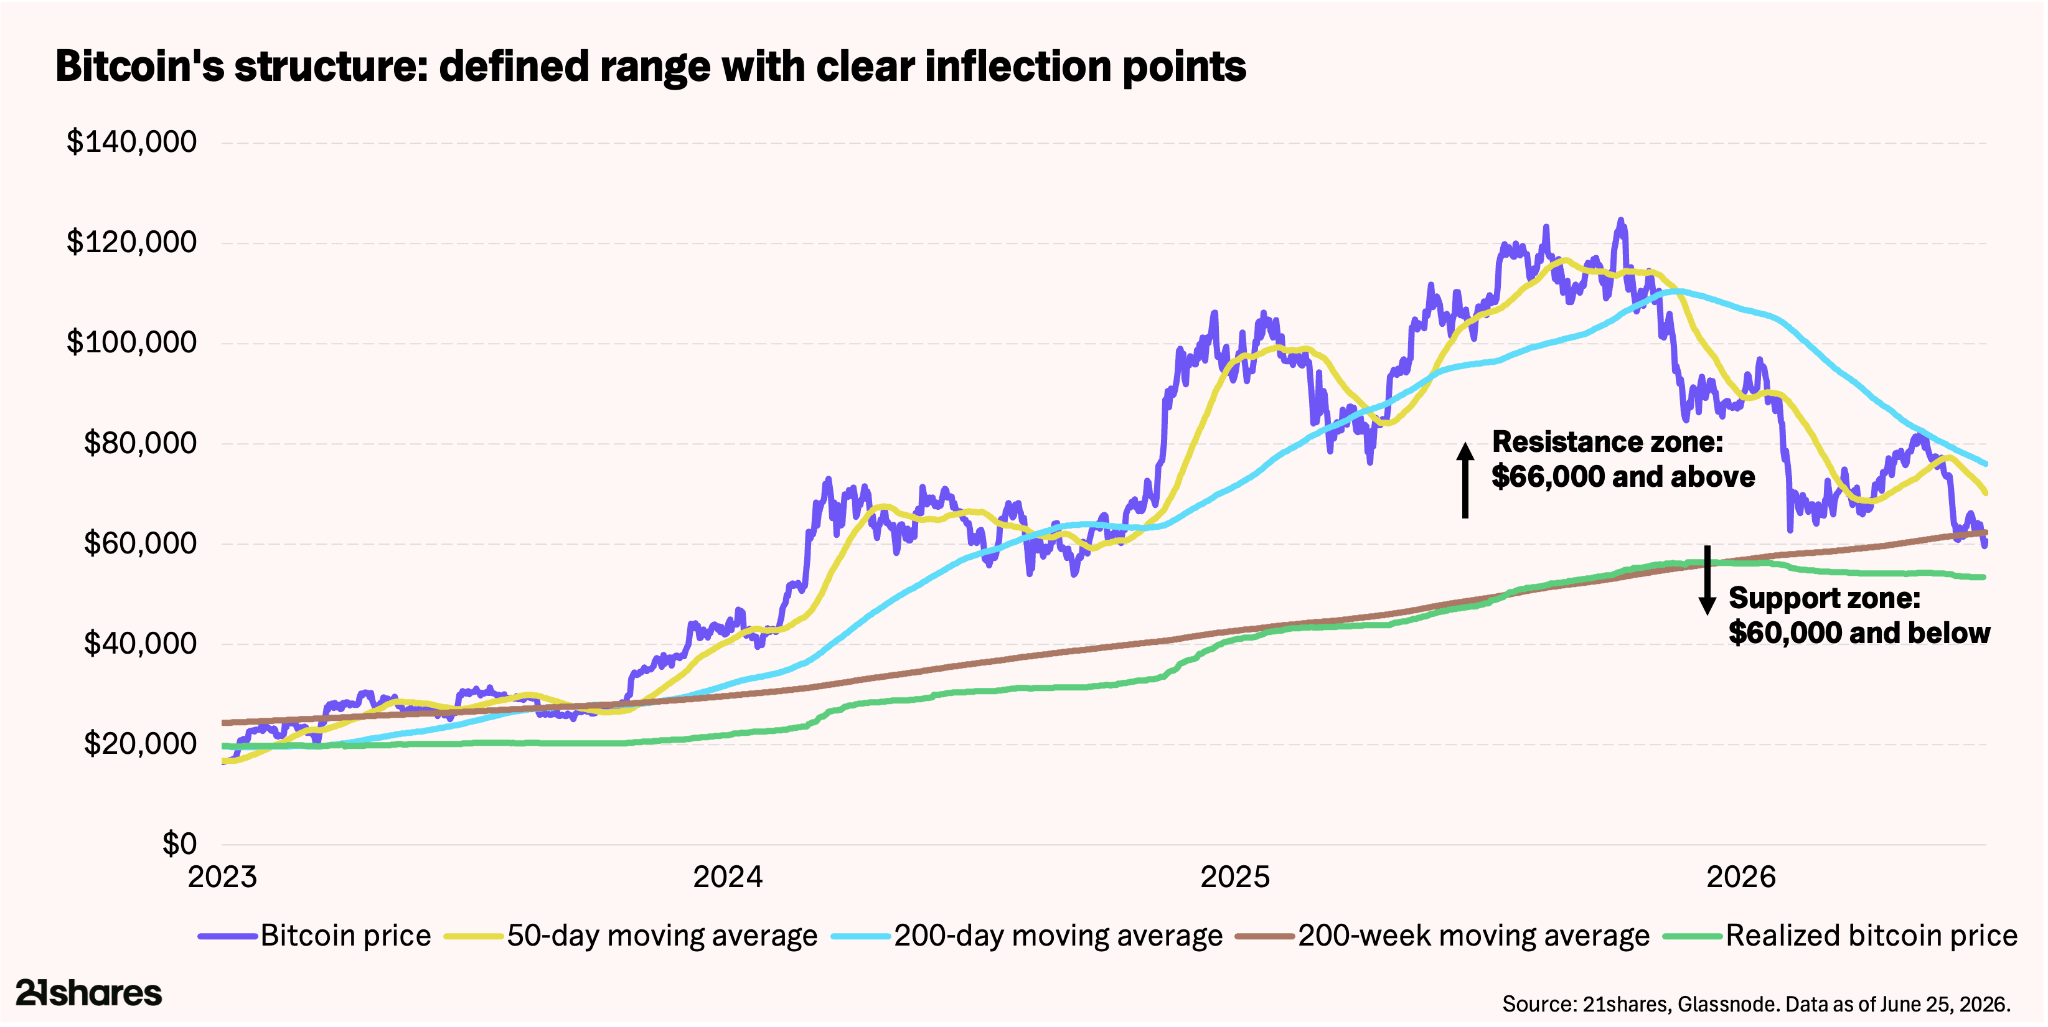
Second, whether bitcoin holds the $59,000–$62,000 zone, where its 200-week moving average converges with a concentration of historical buying. A weekly close below that range is the clearer warning sign.
Third, the November midterms. Since mid-2025, bitcoin has tracked an inverse correlation of -0.79 with Democratic sweep odds on Polymarket: as those odds climbed from ~21% to a ~52% peak in April 2026, bitcoin fell from ~$120,000 to ~$60,000; October 2025's brief Republican surge coincided with the $126,000 cycle high.8 Sweep odds sit at ~42% today, Republican odds at ~18%.
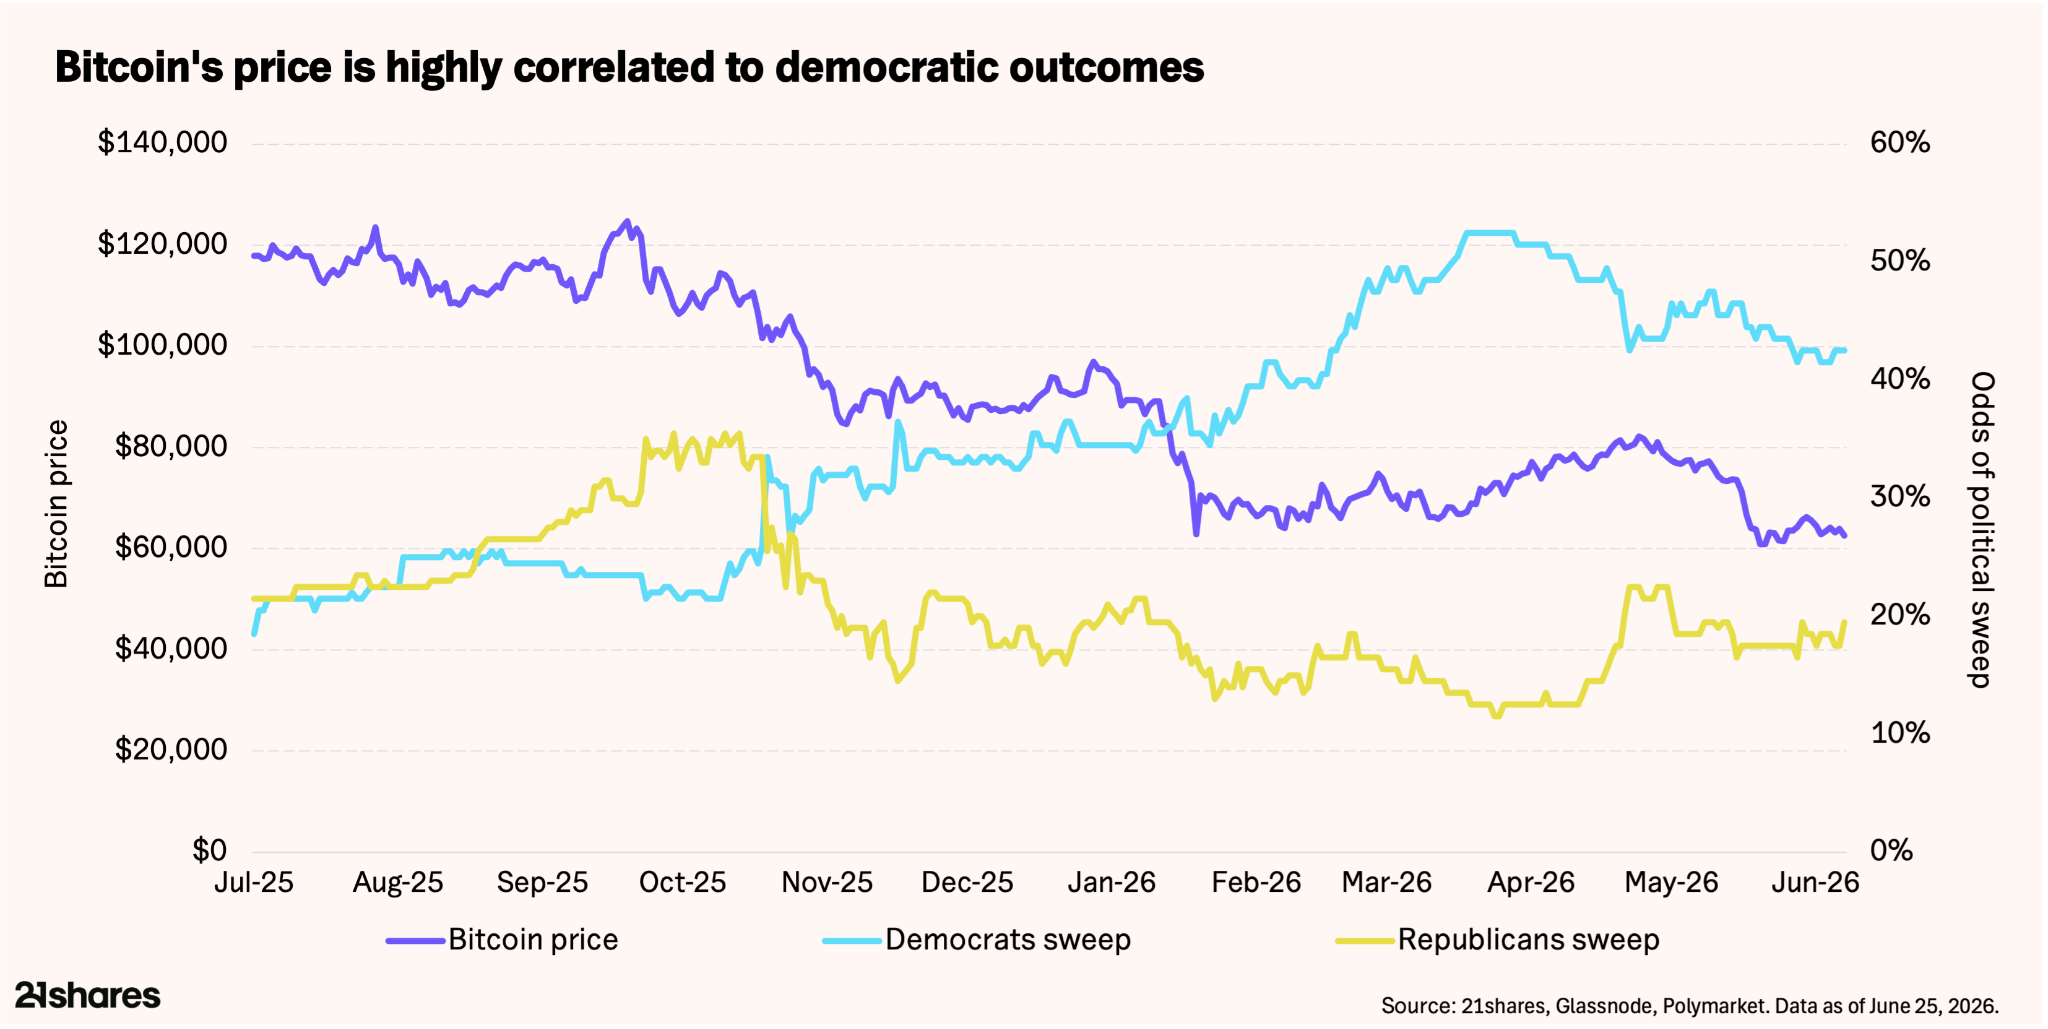
A sustained shift toward a Republican outcome reads as crypto-positive; hardening Democratic expectations reinforce the current ceiling. Watch this through Q3 as positioning builds.
Cutting across all three is Strategy. On June 29, the company authorized selling up to $1.25 billion of bitcoin to fund its cash reserve; that’s the first time it has approved selling rather than buying.9 As established above, the $75,651 average cost is the line: above it, equity issuance is viable; below it, bitcoin sales become the easier choice, and the math gets worse as the price falls – covering a year of dividend commitments requires roughly 16,700 bitcoin at $75,000 and closer to 25,000 at $50,000. Two things will confirm whether the authorization becomes action: the reserve balance in the next filing, and a weekly close above $59,000.
Bull vs. Bear case scenarios
- Bull case: durable de-escalation and a Fed pivot
A durable US–Iran resolution would hand the Fed cover to bring cuts back into H2 2026, making way for Bitcoin to reclaim $66,000, opening the path to $70,000–$75,000, with seasonality a tailwind – July and August have averaged 4.36% bitcoin returns since 2013.10 - Bear case: re-escalation and a hawkish Fed
Tensions in Iran re-escalate, causing inflation to continue, and a hawkish late-July FOMC keeps the Fed restrictive. Bitcoin retests the $50,000–$55,000 zone, last seen pre-election in October 2024 and aligned with its realized price. For context, prior cycles saw 75–85% peak-to-trough drawdowns; applied here, that implies a worst-case trough of $35,000–$45,000 if $50,000 were not to hold.
The long-term thesis for the asset class remains intact, and the fundamentals have, if anything, improved through the drawdown. It is a reminder of why position sizing matters more during a month like June than during the months when prices only go up.
______
Footnotes:
- Federal Reserve. "FOMC Statement." June 17, 2026. https://www.federalreserve.gov/newsevents/pressreleases/monetary20260617a.htm
- Glassnode, "Bitcoin US Spot ETF Net Flows Chart," Glassnode Studio, accessed June 25, 2026. https://studio.glassnode.com/charts/institutions.UsSpotEtfFlowsNet?a=BTC
- U.S. Commodity Futures Trading Commission. "Commitments of Traders, Traders in Financial Futures — CME Bitcoin." June 16, 2026. https://publicreporting.cftc.gov/dataset/Traders-in-Financial-Futures-Futures-Only/gpe5-46if
- Parshwa Turakhiya, "Bitcoin Bears Say BTC Is Repeating the 2022 Pattern—K33 Research Says They're Dead Wrong," Benzinga, May 20, 2026. https://www.benzinga.com/crypto/cryptocurrency/26/05/52690283/bitcoin-bears-say-btc-is-repeating-the-2022-pattern
- Strategy Inc., Form 8-K, U.S. Securities and Exchange Commission, June 22, 2026. https://www.sec.gov/Archives/edgar/data/1050446/000119312526276717/mstr-20260504.htm
- Glassnode, "Bitcoin Overview Dashboard," Glassnode Studio, accessed June 25, 2026. https://studio.glassnode.com/dashboards/asset-overview?a=BTC
- CME Group. "FedWatch Tool." Retrieved June 25, 2026. https://www.cmegroup.com/markets/interest-rates/cme-fedwatch-tool.html
- Polymarket, "2026 Balance of Power: D Senate, D House," accessed June 25, 2026. https://polymarket.com/event/balance-of-power-2026-midterms/2026-balance-of-power-d-senate-d-house-949
- Strategy Inc., "Strategy Provides Capital Structure Update after Completing $1.5 Billion Debt Repurchase," Form 8-K (Exhibit 99.1), U.S. Securities and Exchange Commission, May 26, 2026. https://www.sec.gov/Archives/edgar/data/0001050446/000119312526237907/mstr-ex99_1.htm
- CoinGlass, "Bitcoin Returns History," accessed June 25, 2026. https://www.coinglass.com/today